. 2013 Apr;30(4):881-93.
doi: 10.1093/molbev/mss278. Epub 2012 Dec 10.

Evolutionary and population genomics of the cavity causing bacteria Streptococcus mutans

Affiliations

Evolutionary and population genomics of the cavity causing bacteria Streptococcus mutans

Omar E Cornejo et al. Mol Biol Evol. 2013 Apr.

Abstract

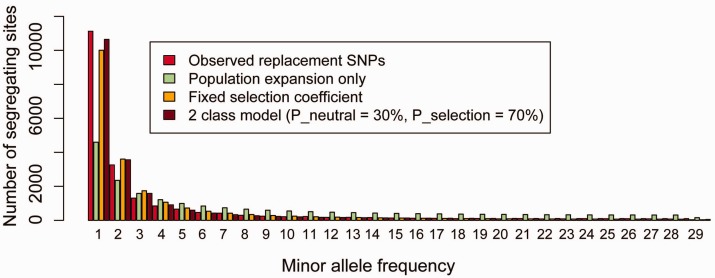
Streptococcus mutans is widely recognized as one of the key etiological agents of human dental caries. Despite its role in this important disease, our present knowledge of gene content variability across the species and its relationship to adaptation is minimal. Estimates of its demographic history are not available. In this study, we generated genome sequences of 57 S. mutans isolates, as well as representative strains of the most closely related species to S. mutans (S. ratti, S. macaccae, and S. criceti), to identify the overall structure and potential adaptive features of the dispensable and core components of the genome. We also performed population genetic analyses on the core genome of the species aimed at understanding the demographic history, and impact of selection shaping its genetic variation. The maximum gene content divergence among strains was approximately 23%, with the majority of strains diverging by 5-15%. The core genome consisted of 1,490 genes and the pan-genome approximately 3,296. Maximum likelihood analysis of the synonymous site frequency spectrum (SFS) suggested that the S. mutans population started expanding exponentially approximately 10,000 years ago (95% confidence interval [CI]: 3,268-14,344 years ago), coincidental with the onset of human agriculture. Analysis of the replacement SFS indicated that a majority of these substitutions are under strong negative selection, and the remainder evolved neutrally. A set of 14 genes was identified as being under positive selection, most of which were involved in either sugar metabolism or acid tolerance. Analysis of the core genome suggested that among 73 genes present in all isolates of S. mutans but absent in other species of the mutans taxonomic group, the majority can be associated with metabolic processes that could have contributed to the successful adaptation of S. mutans to its new niche, the human mouth, and with the dietary changes that accompanied the origin of agriculture.


Figures

F<sc>ig</sc>. 1.
Fig. 1.
Demographic history of Streptococcus mutans. (a) Schematic representation of S. mutans population history. The timeline (in years before present) represents the start of the expansion of cariogenic bacteria after the onset of agriculture, calibrated using an experimentally determined mutation rate for bacteria (Drake 1991), concomitant with an in vivo determined generation time for oral flora bacteria (Gibbons 1964) (see Materials and Methods and Supplementary Material online, for details). (b) The observed distribution of number of synonymous SNPs at a given frequency in the sample of 58 isolates (blue) is shown, as well as the expectation under the parameters that generate the best fit demographic model (dark blue). The difference between the two distributions is not significant. The distribution under a standard neutral model with constant population size is shown in light blue (significant KS, P < 0.0001). (c) The bi-dimensional likelihood profile for combination of parameters ν (ratio of current to ancestral population size) in the x axis and the time at the beginning of the demographic expansion (scaled in generations/2Na) in the y axis. The maximum likelihood value is shown as a white dot and the 95% CI is highlighted as a white dotted line. 95% CI estimated from bootstrapped data can be found in supplementary figure S7, Supplementary Material online.
F<sc>ig</sc>. 2.
Fig. 2.
Recombination in Streptococcus mutans. (a) The inferred distribution of recombination tracts (gene conversion) among isolates of S. mutans. Gene tracts of the core genome that served as alignment for the estimation of recombination along the genome are represented in blue and red. Tracts of significant gene conversion events detected along the genome are represented in green. (b) The distribution of gene conversion tract lengths, characterized by a wide range of values that follow a geometric distribution.
F<sc>ig</sc>. 3.
Fig. 3.
Evidence of genome-wide selective constraints in Streptococcus mutans. The observed distribution of number of replacement SNPs at a given frequency in the sample of 58 isolates is shown in red. The expectation is that replacement changes will have an effect on the fitness of individuals, so it is unlikely that they behave neutrally. Correcting for population expansion inferred from the silent SNPs (fig. 1), does not account for the excess of singletons observed in the data (light green). On the other hand, a model that allows for selection affecting changes in allele frequency, after correcting for demography, yields a superior fit, suggesting that in the S. mutans genome 30% of the replacement changes are neutral and 70% are under strong selection (γ = −17, where γ = 2Nes, and Ne is the current population size and s is the coefficient of selection).
F<sc>ig</sc>. 4.
Fig. 4.
Genome map of Streptococcus mutans. (a) Representation of the forward coding (light blue) and reverse coding (light red) genes comprising the core genome of S. mutans. The third inner circle, displays the unique core genes, present in S. mutans only, colored by the metabolic functions in which they are involved. The most inner circles present the unique genes shown to be upregulated or downregulated by the impacts coincident with the diet change of humans after the origin of agriculture: starch and sucrose metabolism and low environmental pH. (b) Putative origin of laterally transferred unique core genes in S. mutans..

References

    1. Aas JA, Paster BJ, Stokes LN, Olsen I, Dewhirst FE. Defining the normal bacterial flora of the oral cavity. J Clin Microbiol. 2005;43:5721–5732. - PMC - PubMed
    1. Abbe K, Carlsson J, Takahashi-Abbe S, Yamada T. Oxygen and the sugar metabolism in oral streptococci. Proc Finn Dent Soc. 1991;87:477–487. - PubMed
    1. Ahn SJ, Browngardt CM, Burne RA. Changes in biochemical and phenotypic properties of Streptococcus mutans during growth with aeration. Appl Environ Microbiol. 2009;75:2517–2527. - PMC - PubMed
    1. Ahn SJ, Burne RA. Effects of oxygen on biofilm formation and the AtlA autolysin of Streptococcus mutans. J Bacteriol. 2007;189:6293–6302. - PMC - PubMed
    1. Ajdic D, McShan WM, McLaughlin RE, et al. (19 co-authors) Genome sequence of Streptococcus mutans UA159, a cariogenic dental pathogen. Proc Natl Acad Sci U S A. 2002;99:14434–14439. - PMC - PubMed

Publication types