. 2013;34(2):349-65.
doi: 10.3233/JAD-121171.

SPION-enhanced magnetic resonance imaging of Alzheimer's disease plaques in AβPP/PS-1 transgenic mouse brain

Affiliations

SPION-enhanced magnetic resonance imaging of Alzheimer's disease plaques in AβPP/PS-1 transgenic mouse brain

Laurel O Sillerud et al. J Alzheimers Dis. 2013.

Abstract

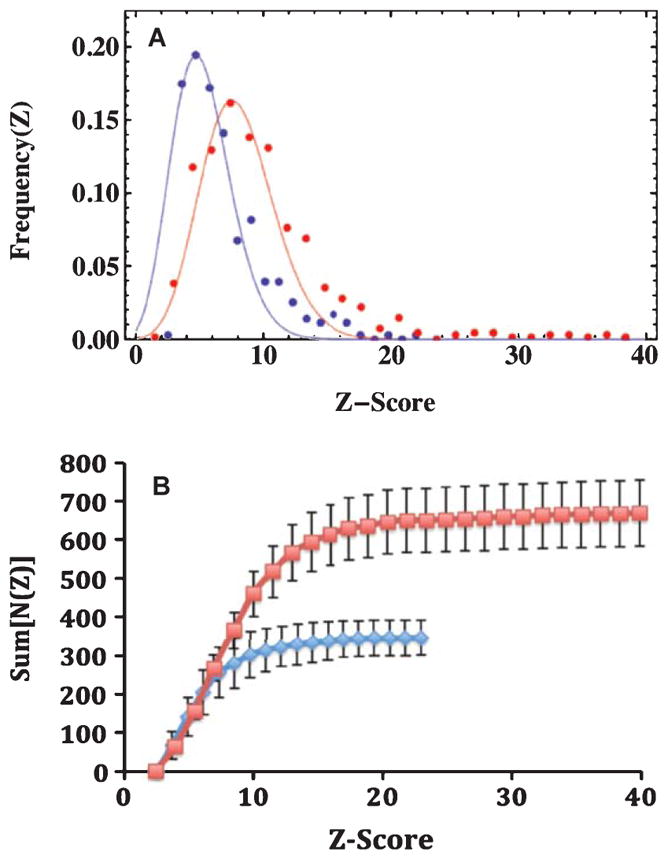
In our program to develop non-invasive magnetic resonance imaging (MRI) methods for the diagnosis of Alzheimer's disease (AD), we have synthesized antibody-conjugated, superparamagnetic iron oxide nanoparticles (SPIONs) for use as an in vivo agent for MRI detection of amyloid-β plaques in AD. Here we report studies in AβPP/PS1 transgenic mice, which demonstrate the ability of novel anti-AβPP conjugated SPIONs to penetrate the blood-brain barrier to act as a contrast agent for MR imaging of plaques. The conspicuity of the plaques increased from an average Z-score of 5.1 ± 0.5 to 8.3 ± 0.2 when the plaque contrast to noise ratio was compared in control AD mice with AD mice treated with SPIONs. The number of MRI-visible plaques per brain increased from 347 ± 45 in the control AD mice, to 668 ± 86 in the SPION treated mice. These results indicated that our SPION enhanced amyloid-β detection method delivers an efficacious, non-invasive MRI detection method in transgenic mice.


Figures

Fig. 1
Fig. 1
Optical microscopy of AβPP/PS1 and control mouse brains. A) IHC stained cortical section (7 μm thick) of the fixed brain from a transgenic mouse used in these studies. Plaques stained brown with antibodies against human Aβ. The positive DAB signal at the cortical surface could represent some BBB leakage allowing passage of mouse IgGs. Scale bar = 1,000 μm. B) Control brain section from a wild-type mouse showing a complete lack of IHC positive regions. Scale bar = 1,000 μm. C) Section from the brain of a transgenic mouse stained in vitro for iron using Perl’s reagent demonstrating binding of our anti-AβPP conjugated SPIONs to plaque. Scale bar = 20 μm. D) Control brain section from a wild-type mouse demonstrating the lack of blue staining when incubated with the same SPIONs as in (C). Scale bar = 20 μm. E) Perl-stained section of a brain from an AβPP/PS1 transgenic mouse that was injected with anti-AβPP SPIONs. Note the large plaque with its associated SPIONs (arrow). Scale bar = 20 μm. F) Thioflavin-S stained brain section from a transgenic mouse demonstrating the presence of plaques as green regions. Scale bar = 10 μm. G) IHC of a cortical brain section stained for AβPP with the anti-AβPP antibodies used to modify the SPIONs showing plaque detection similar to (A). Scale bar = 10 μm. H) Perl’s stain for iron in an AβPP/PS1 brain showing no iron detection (Compare with (C)). Scale bar = 10 μm.
Fig. 2
Fig. 2
Histological plaque distribution in the AβPP/PS1 mouse brain. A) Optical microscopy of a 7 μm thick coronal section of a transgenic mouse brain stained, via immunohistochemistry, for human Aβ, which revealed the plaques as brown spots. B) A binary image, thresholded using ImageJ, showing the segmentation of the image in (A) into recognized plaques whose areas were subsequently measured. This particular slice contained a total of 198 plaques. C) Distribution of plaque sizes (radii) in the AβPP/PS1 mouse brain. The measured radii are shown as blue circles, while the red curve is a fitted Gaussian with a mean of 8.0 μm and a width of 3.5 μm. A Poisson fit gave essentially the same results as the Gaussian fit.
Fig. 3
Fig. 3
Surface coil MR images of AβPP/PS1 mouse brain at 9.4T. A) One of thirty, 120 μm thick, slices from an AβPP/PS1 mouse brain untreated with SPIONs, which demonstrated the MR imaging of plaques without the aid of a contrast agent. This brain contained 355 plaques whose Z-scores exceeded 2.5. The mean Z-score for this brain was 4.6 (See Fig. 4A–C for the 3D plaque distribution for this brain). B) One of thirty, 120 μm thick, slices from the brain of an AβPP/PS1 transgenic mouse that was treated with the injection of anti-AβPP conjugated SPIONs for 24 h and then sacrificed. Note how the SPIONs enhanced the conspicuity of the plaques. The mean Z-score for this brain was 8.0 (See Fig. 4D–F for the 3D plaque distribution for this brain).
Fig. 4
Fig. 4
A–C) Three-dimensional displays of the complete plaque distribution in the brain of an AβPP/PS1 mouse untreated with SPIONs. The 3D plaque distribution data were embedded within a Mathematica-rendered surface plot of the mouse brain generated from coordinates obtained from the Allen Institute for Brain Science. The size and color of each sphere was proportional to the Z-score of the plaque located at that set of (x, y, z) coordinates measured from the MR images (given in Fig. 3A) showing that plaques (n = 355) were detected without the aid of a contrast agent (Z = 4.6 ± 0.6). Red corresponded to Z = 2.5, while purple coded Z = 20. The diameter of each sphere gave its Z-score in these coordinates. A) A coronal view of the brain from the front. Note the predominance of lesions in the cortex from this viewpoint. B) A sagittal view of the brain from the left side, the front was to the left. C) A transverse view of the brain from the top, the front was at the bottom. D–F) Three-dimensional displays of the complete plaque distribution in the brain of an AβPP/PS1 mouse treated with anti-human AβPP-conjugated SPIONs. Size and color correlate as in A, B, and C. SPION treatment demonstrated a marked increase in both the number (n = 668) and the Z-score (8.0 ± 0.1) of the detected lesions. D) A coronal view of the brain from the front. E) A sagittal view of the brain from the left side, the front was to the left. F) A transverse view of the brain from the top, the front was at the bottom.
Fig. 5
Fig. 5
The distribution of Z-scores from the MRI data among brains from the AβPP/PS1 mice imaged for this study. A) Poisson fits to the normalized differential frequency distributions of Z-scores for MRI detected plaques in the brains of AβPP/PS1 mice comparing SPION treatment with controls. The Blue points and curve were data from control mice, with a mean of 5.1 (n = 355 plaques), while the Red points and curve were from mice treated with anti-AβPP SPIONs, with a mean of 8.3 (n = 668 plaques). Note how the presence of SPI-ONs in the brain markedly increased the conspicuity (Z-score) of the plaques. The normalized Z-score data were well fit by Poisson distributions, whose means were the only free parameters of the fits. Once the means were specified, the amplitudes and widths were fixed. The probability that the means of the two distributions were the same was p < 0.0001 as reported by Student’s t-test with unequal variances. B) The integral distributions of the MRI-determined plaque data. The colors indicate the treatment received: Blue diamonds were for control AβPP/PS1 mice, while the Red squares denote the data from AβPP/PS1 mice injected with anti-human AβPP conjugated SPI-ONs. The errors shown are the standard deviations (n = 4). The brains from the SPION injected mice displayed twice as many lesions (668) as the control mice (347) with a marked increase in the maximum Z-score from 23 to 40.

Similar articles

Cited by

References

    1. Hebert LE, Scherr PA, Bienias JL, Bennett DA, Evans DA. Alzheimer’s disease in the U.S. population: Prevalence estimates using the 2000 census. Arch Neurol. 2003;60:1119–1122. - PubMed
    1. Fodero-Tavoletti AT, Villemagne VL, Rowe CC, Masters CL, Barnham KJ, Cappai R. Amyloid-β: The seeds of darkness. Int J Biochem Cell Biol. 2011;43:1247–1251. - PubMed
    1. Iqbal K, Liu F, Gong C, Grundke-Iqbal I. Tau in Alzheimer disease and related tauopathies. Curr Alzheimer Res. 2010;7:656–664. - PMC - PubMed
    1. Masters CL, Cappai R, Barnham KJ, Villemagne VL. Molecular mechanisms for Alzheimer’s disease: Implications for neuroimaging and therapeutics. J Neurochem. 2006;106:1700–1725. - PubMed
    1. Karran E, Mercken M, De Strooper B. The amyloid cascade hypothesis for Alzheimer’s disease: An appraisal for the development of therapeutics. Nat Med. 2011;10:698–712. - PubMed

Publication types