

Different patterns of perceptual learning on spectral modulation detection between older hearing-impaired and younger normal-hearing adults
- PMID: 23229719
- PMCID: PMC3660913
- DOI: 10.1007/s10162-012-0363-y
Different patterns of perceptual learning on spectral modulation detection between older hearing-impaired and younger normal-hearing adults
Abstract
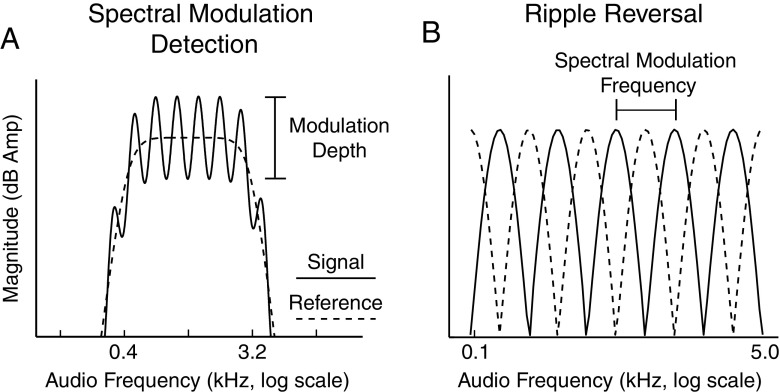
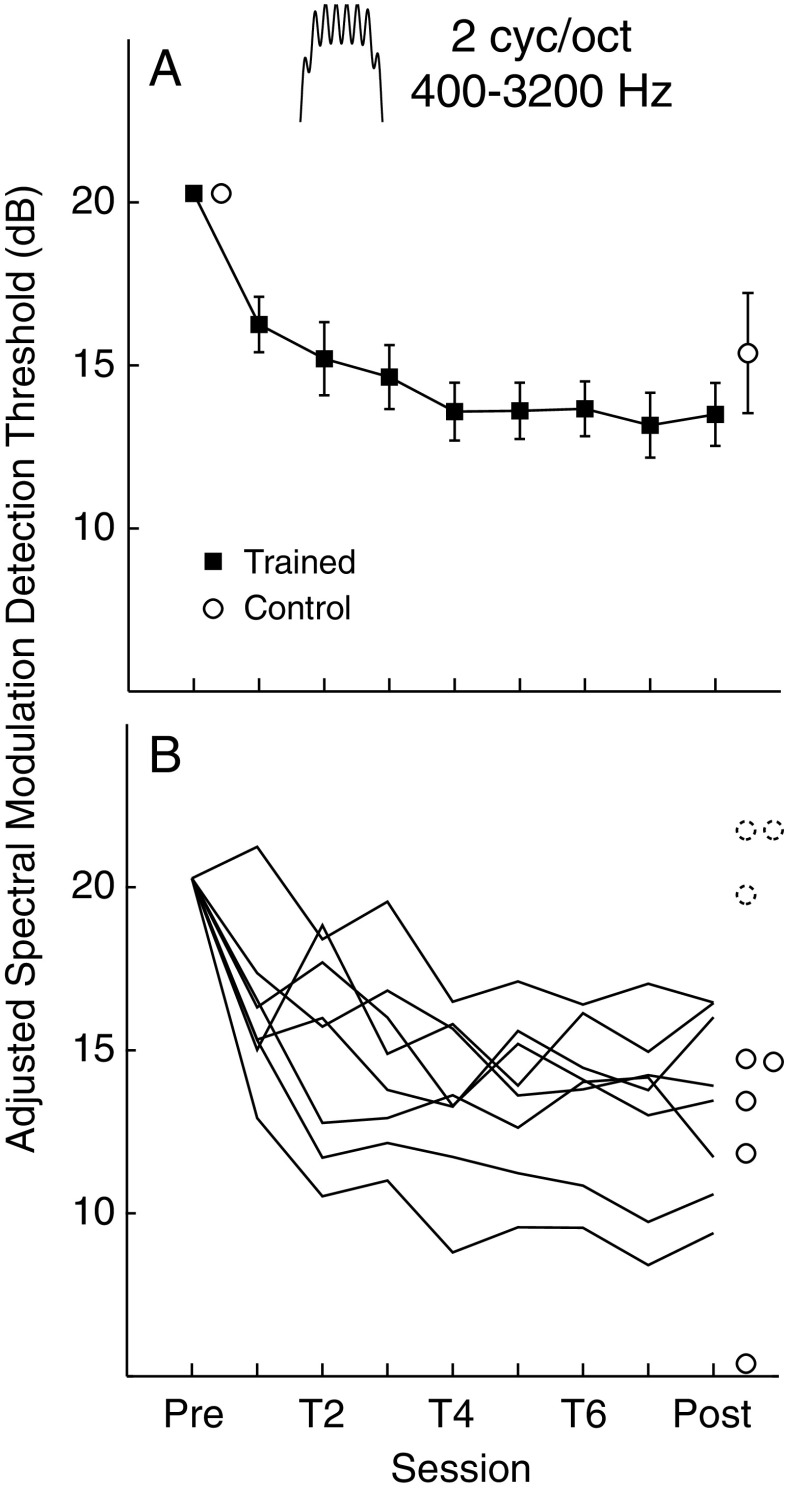
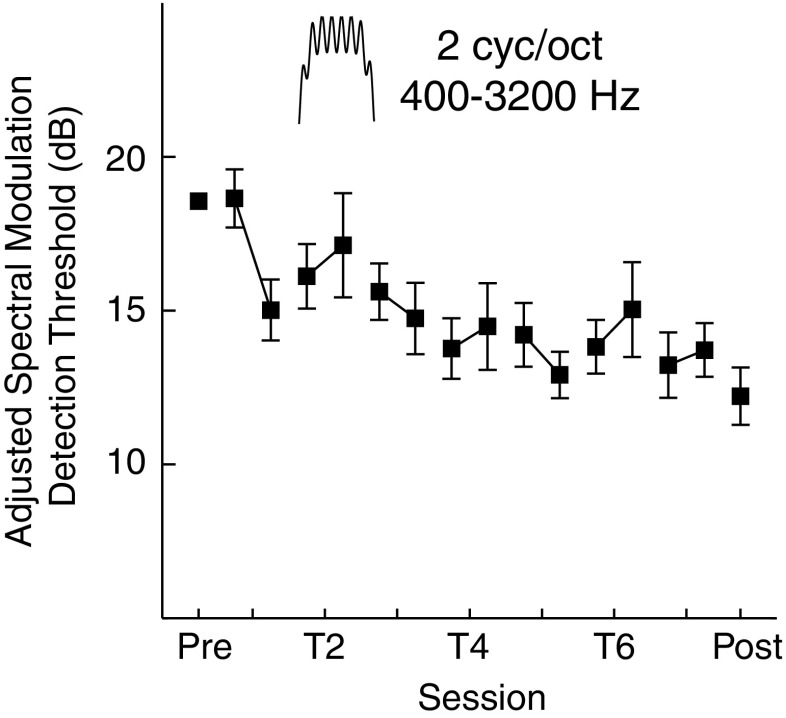
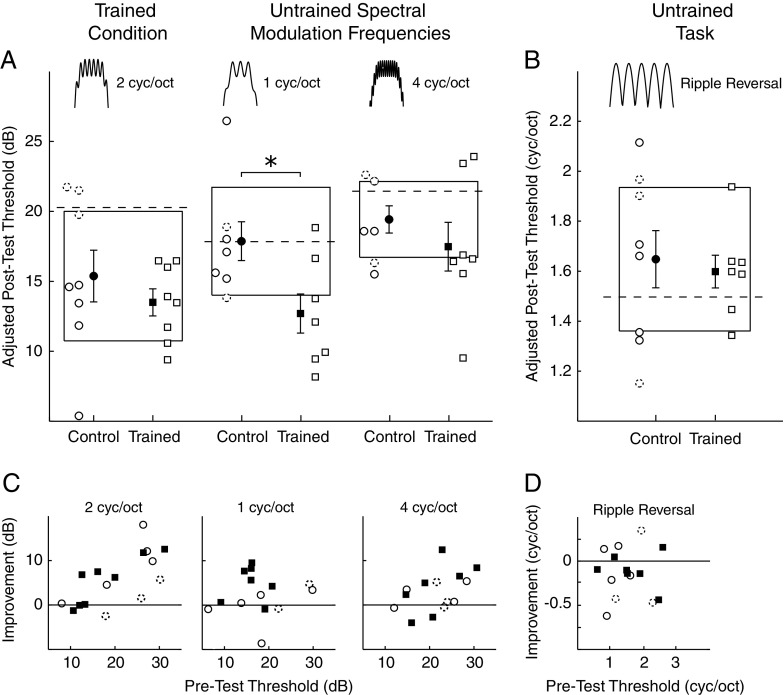
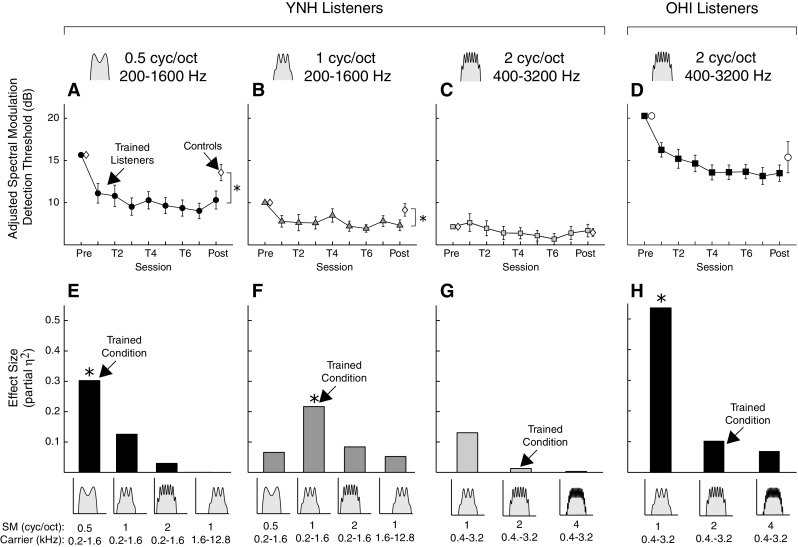
Young adults with normal hearing (YNH) can improve their sensitivity to basic acoustic features with practice. However, it is not known to what extent the influence of the same training regimen differs between YNH listeners and older listeners with hearing impairment (OHI)--the largest population seeking treatment in audiology clinics. To examine this issue, we trained OHI listeners on a basic auditory task (spectral modulation detection) using a training regimen previously administered to YNH listeners (≈ 1 h/session for seven sessions on a single condition). For the trained conditions on which pretraining performance was not already at asymptote, the YNH listeners who received training learned more than matched controls who received none, but that learning did not generalize to any untrained spectral modulation frequency. In contrast, the OHI-trained listeners and controls learned similar amounts on the trained condition, implying no effect of the training itself. However, surprisingly the OHI-trained listeners improved over the training phase and on an untrained spectral modulation frequency. These population differences suggest that learning consolidated more slowly, and that training modified an aspect of processing that had broader tuning to spectral modulation frequency, in OHI than YNH listeners. More generally, these results demonstrate that conclusions about perceptual learning that come from examination of one population do not necessarily apply to another.
Figures
Similar articles
-
Effects of spectral manipulations of music mixes on musical scene analysis abilities of hearing-impaired listeners.PLoS One. 2025 Jan 10;20(1):e0316442. doi: 10.1371/journal.pone.0316442. eCollection 2025. PLoS One. 2025. PMID: 39792818 Free PMC article.
-
Effects of Varying Reverberation on Music Perception for Young Normal-Hearing and Old Hearing-Impaired Listeners.Trends Hear. 2018 Jan-Dec;22:2331216517750706. doi: 10.1177/2331216517750706. Trends Hear. 2018. PMID: 29320944 Free PMC article.
-
Talker Differences in Clear and Conversational Speech: Perceived Sentence Clarity for Young Adults With Normal Hearing and Older Adults With Hearing Loss.J Speech Lang Hear Res. 2018 Jan 22;61(1):159-173. doi: 10.1044/2017_JSLHR-H-17-0082. J Speech Lang Hear Res. 2018. PMID: 29270637 Free PMC article.
-
How Do Age and Hearing Loss Impact Spectral Envelope Perception?J Speech Lang Hear Res. 2018 Sep 19;61(9):2376-2385. doi: 10.1044/2018_JSLHR-H-18-0056. J Speech Lang Hear Res. 2018. PMID: 30178062 Free PMC article.
-
Auditory and cognitive effects of aging on perception of environmental sounds in natural auditory scenes.J Speech Lang Hear Res. 2013 Oct;56(5):1373-88. doi: 10.1044/1092-4388(2013/12-0283). Epub 2013 Aug 7. J Speech Lang Hear Res. 2013. PMID: 23926291 Free PMC article.
Cited by
-
Partial maintenance of auditory-based cognitive training benefits in older adults.Neuropsychologia. 2014 Sep;62:286-96. doi: 10.1016/j.neuropsychologia.2014.07.034. Epub 2014 Aug 8. Neuropsychologia. 2014. PMID: 25111032 Free PMC article. Clinical Trial.
-
Rate Discrimination Training May Partially Restore Temporal Processing Abilities from Age-Related Deficits.J Assoc Res Otolaryngol. 2022 Dec;23(6):771-786. doi: 10.1007/s10162-022-00859-x. Epub 2022 Aug 10. J Assoc Res Otolaryngol. 2022. PMID: 35948694 Free PMC article. Clinical Trial.
-
Relationship between perceptual learning in speech and statistical learning in younger and older adults.Front Hum Neurosci. 2014 Sep 1;8:628. doi: 10.3389/fnhum.2014.00628. eCollection 2014. Front Hum Neurosci. 2014. PMID: 25225475 Free PMC article.
-
Enhancing speech learning by combining task practice with periods of stimulus exposure without practice.J Acoust Soc Am. 2015 Aug;138(2):928-37. doi: 10.1121/1.4927411. J Acoust Soc Am. 2015. PMID: 26328708 Free PMC article.
-
Auditory Learning and Generalization in Older Adults: Evidence from Voice Discrimination Training.Trends Hear. 2025 Jan-Dec;29:23312165251342436. doi: 10.1177/23312165251342436. Epub 2025 May 27. Trends Hear. 2025. PMID: 40420656 Free PMC article.
References
Publication types
MeSH terms
Grants and funding
LinkOut - more resources
Full Text Sources
Medical
