

p63 regulates cell proliferation and cell cycle progression‑associated genes in stromal cells of giant cell tumor of the bone
- PMID: 23229819
- PMCID: PMC3583652
- DOI: 10.3892/ijo.2012.1727
p63 regulates cell proliferation and cell cycle progression‑associated genes in stromal cells of giant cell tumor of the bone
Abstract
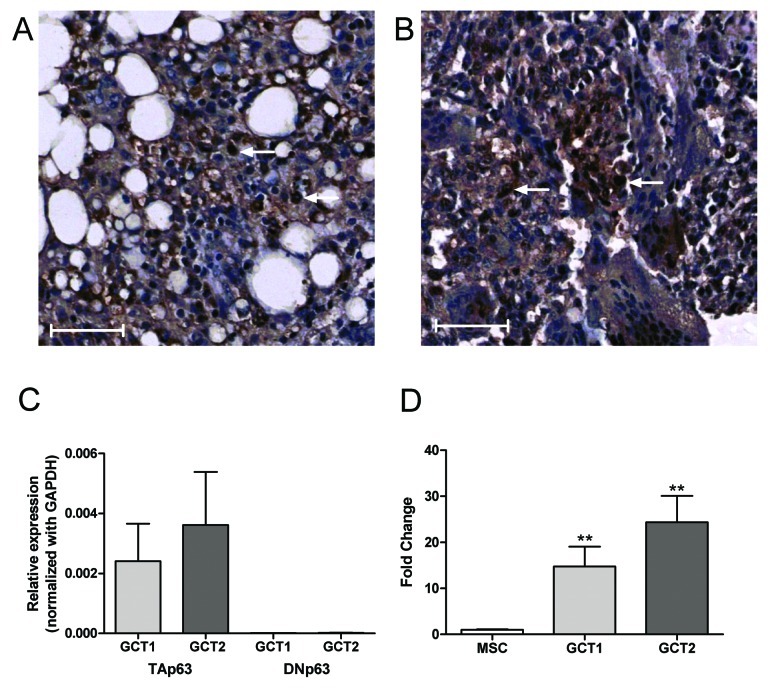
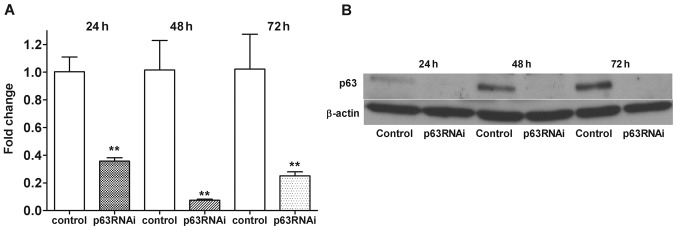
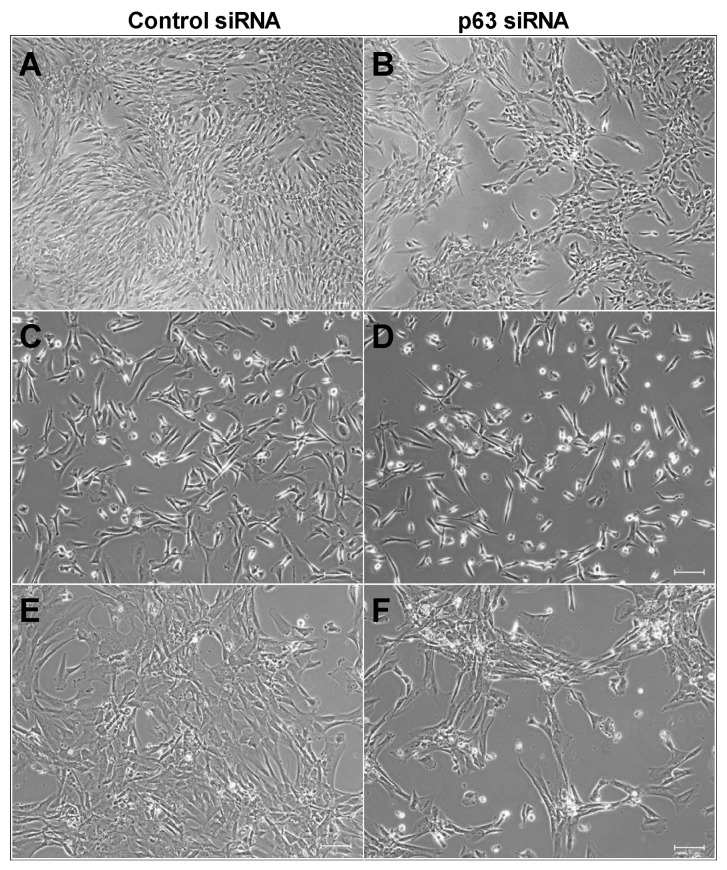
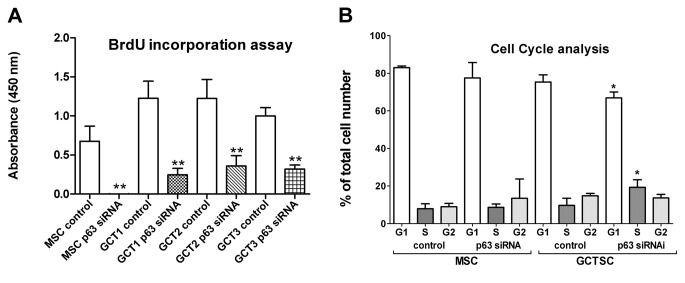
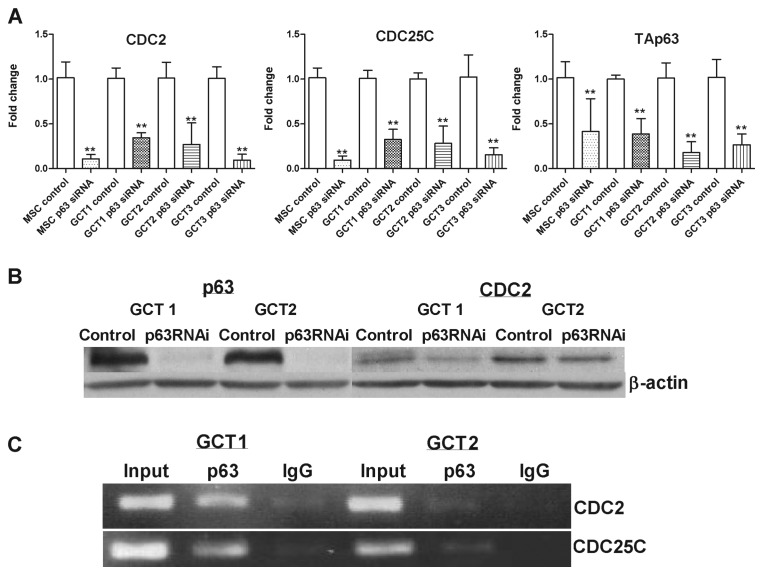
Giant cell tumor of bone (GCT) is a destructive neoplasm of uncertain etiology that affects the epiphyseal ends of long bones in young adults. GCT stromal cells (GCTSCs) are the primary neoplastic cells of this tumor and are the only proliferating cell component in long-term culture, which recruits osteoclast-like giant cells that eventually mediate bone destruction. The oncogenesis of GCT and factors driving the neoplastic stromal cells to proliferate extensively and pause at an early differentiation stage of pre-osteoblast lineage remain unknown. Overexpression of p63 was observed in GCTSCs and there is growing evidence that p63 is involved in oncogenesis through different mechanisms. This study aimed to understand the specific role of p63 in cell proliferation and oncogenesis of GCTSCs. We confirmed p63 expression in the mononuclear cells in GCT by immunohistochemical staining. By real-time PCR analysis, we showed a higher level (>15‑fold) of TAp63 expression in GCTSCs compared to that in mesenchymal stem cells. Furthermore, we observed that knockdown of the p63 gene by siRNA transfection greatly reduced cell proliferation and induced cell cycle arrest at S phase in GCTSCs. We found that the mRNA expression of CDC2 and CDC25C was substantially suppressed by p63 knockdown at 24-72 h. Moreover, p63 was found to be recruited on the regulatory regions of CDC2 and CDC25C, which contain p53-responsive elements. In summary, our data suggest that p63 regulates GCTSC proliferation by binding to the CDC2 and CDC25C p53-REs, which may inhibit the p53 tumor suppressor activity and contribute to GCT tumorigenesis.
Figures
Similar articles
-
Silencing of the UCHL1 gene in giant cell tumors of bone.Int J Cancer. 2010 Oct 15;127(8):1804-12. doi: 10.1002/ijc.25205. Int J Cancer. 2010. PMID: 20104524
-
Expression of preosteoblast markers and Cbfa-1 and Osterix gene transcripts in stromal tumour cells of giant cell tumour of bone.Bone. 2004 Mar;34(3):393-401. doi: 10.1016/j.bone.2003.10.013. Bone. 2004. PMID: 15003787
-
Differential gene expression in stromal cells of human giant cell tumor of bone.Virchows Arch. 2004 Dec;445(6):621-30. doi: 10.1007/s00428-004-1113-2. Epub 2004 Sep 23. Virchows Arch. 2004. PMID: 15449052
-
[Histogenesis of giant cell tumors].Pathologe. 2002 Sep;23(5):332-9. doi: 10.1007/s00292-002-0552-2. Epub 2002 Aug 28. Pathologe. 2002. PMID: 12376858 Review. German.
-
The two faces of giant cell tumor of bone.Cancer Lett. 2020 Oct 1;489:1-8. doi: 10.1016/j.canlet.2020.05.031. Epub 2020 Jun 2. Cancer Lett. 2020. PMID: 32502498 Review.
Cited by
-
TIP60 up-regulates ΔNp63α to promote cellular proliferation.J Biol Chem. 2019 Nov 8;294(45):17007-17016. doi: 10.1074/jbc.RA119.010388. Epub 2019 Oct 10. J Biol Chem. 2019. PMID: 31601649 Free PMC article.
-
Differential expression of filamin B splice variants in giant cell tumor cells.Oncol Rep. 2016 Dec;36(6):3181-3187. doi: 10.3892/or.2016.5197. Epub 2016 Oct 24. Oncol Rep. 2016. PMID: 27779699 Free PMC article.
-
Intratibial injection of patient-derived tumor cells from giant cell tumor of bone elicits osteolytic reaction in nude mouse.Oncol Lett. 2018 Oct;16(4):4649-4655. doi: 10.3892/ol.2018.9148. Epub 2018 Jul 16. Oncol Lett. 2018. PMID: 30214599 Free PMC article.
-
A diagnosis of giant cell-rich tumour of bone is supported by p63 immunohistochemistry, when more than 50 % of cells is stained.Virchows Arch. 2014 Oct;465(4):487-94. doi: 10.1007/s00428-014-1637-z. Epub 2014 Aug 7. Virchows Arch. 2014. PMID: 25100342
-
TP63 Is Significantly Upregulated in Diabetic Kidney.Int J Mol Sci. 2021 Apr 15;22(8):4070. doi: 10.3390/ijms22084070. Int J Mol Sci. 2021. PMID: 33920782 Free PMC article.
References
-
- Goldring SR, Schille AL, Mankin HJ, Dayer JM, Krane SM. Characterization of cells from human giant cell tumors of bone. Clin Orthop Relat Res. 1986;204:59–75. - PubMed
-
- Zheng MH, Robbins P, Xu J, Huang L, Wood DJ, Papadimitriou JM. The histogenesis of giant cell tumor of bone: a model of interaction between neoplastic cells and osteoclasts. Histol Histopathol. 2001;16:297–307. - PubMed
-
- Huang L, Teng XY, Cheng YY, Lee KM, Kumta SM. Expression of preosteoblast markers and Cbfa-1 and Osterix gene transcripts in stromal tumor cells of giant cell tumor of bone. Bone. 2004;34:393–401. - PubMed
-
- Sciot R, Dorfman H, Brys P, et al. Cytogenetic-morphologic correlations in aneurismal bone cyst, giant cell tumor of bone and combined lesions. Mod Pathol. 2000;13:1206–1210. - PubMed
Publication types
MeSH terms
Substances
LinkOut - more resources
Full Text Sources
Medical
Research Materials
Miscellaneous
