. 2012 Dec 17;209(13):2485-99.
doi: 10.1084/jem.20121015. Epub 2012 Dec 10.

Programmed death 1 protects from fatal circulatory failure during systemic virus infection of mice

Affiliations

Programmed death 1 protects from fatal circulatory failure during systemic virus infection of mice

Helge Frebel et al. J Exp Med. .

Abstract

The inhibitory programmed death 1 (PD-1)-programmed death ligand 1 (PD-L1) pathway contributes to the functional down-regulation of T cell responses during persistent systemic and local virus infections. The blockade of PD-1-PD-L1-mediated inhibition is considered as a therapeutic approach to reinvigorate antiviral T cell responses. Yet previous studies reported that PD-L1-deficient mice develop fatal pathology during early systemic lymphocytic choriomeningitis virus (LCMV) infection, suggesting a host protective role of T cell down-regulation. As the exact mechanisms of pathology development remained unclear, we set out to delineate in detail the underlying pathogenesis. Mice deficient in PD-1-PD-L1 signaling or lacking PD-1 signaling in CD8 T cells succumbed to fatal CD8 T cell-mediated immunopathology early after systemic LCMV infection. In the absence of regulation via PD-1, CD8 T cells killed infected vascular endothelial cells via perforin-mediated cytolysis, thereby severely compromising vascular integrity. This resulted in systemic vascular leakage and a consequential collapse of the circulatory system. Our results indicate that the PD-1-PD-L1 pathway protects the vascular system from severe CD8 T cell-mediated damage during early systemic LCMV infection, highlighting a pivotal physiological role of T cell down-regulation and suggesting the potential development of immunopathological side effects when interfering with the PD-1-PD-L1 pathway during systemic virus infections.


Figures
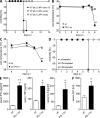
Figure 1.
Figure 1.
PD-1 KO mice develop fatal CD8 T cell–dependent pathology during early systemic LCMV infection. (A) PD-1 KO mice were infected with 106 pfu LCMV clone 13, 106 pfu LCMV docile, or 102 pfu LCMV docile and monitored for morbidity (hunched back, ruffled fur, and reduced motoric activity). (B and C) Core temperatures were measured in WT and PD-1 KO mice (B), untreated and αPD-L1–treated WT mice (C). (D) Morbidity was monitored in undepleted and CD8 T cell– or CD4 T cell–depleted PD-1 KO mice at the indicated times after infection with 106 pfu LCMV docile. (E) Cytokine concentrations in the sera of WT and PD-1 KO mice were analyzed on day 6 after 106 pfu LCMV docile infection. A–E: n = 3–4 mice per group. Means ± SEM from one representative of two experiments are shown. (F) Liver AST concentrations in the sera of WT and PD-1 KO mice were determined on day 6 after infection. WT, n = 8 mice; KO, n = 7 mice. Means ± SEM from two pooled experiments are shown. *, P < 0.05; **, P < 0.01 (unpaired two-tailed Student’s t test).
Figure 2.
Figure 2.
PD-1–deficient virus-specific CD8 T cells are more functional and pathogenic. (A and B) WT mice were transferred with 104 PD-1+/+ or PD-1−/− P14 cells, followed by 106 pfu LCMV docile infection on the next day. On day 6 p.i., percentages and total numbers of splenic P14 cells were determined. The percentage of IFN-γ–producing cells in transferred P14 cells (A) and the mean fluorescence intensity of IFN-γ (B) were measured after restimulation with GP33 peptide. n = 3–4 mice per group. Means ± SEM from one representative of two experiments are shown. (C) Serum concentrations of IFN-γ were analyzed on day 6 after infection. n = 3–4 mice per group. Means ± SEM from one representative of two experiments are shown. (D) Splenic virus titers were analyzed on day 6 after infection. n = 8 mice per group. Means ± SEM from two pooled experiments are shown. (E) Serum levels of liver AST were determined and photos of PBS-perfused liver lobes were taken on day 6 p.i. The arrow indicates a focal necrotic liver lesion. n = 3–4 mice per group. Means ± SEM from one representative of two experiments and photos from representative mice from one of two experiments are shown. (F) WT mice were transferred with 2.5 × 10⁴ PD-1+/+ or PD-1−/− P14 cells, followed by 106 pfu LCMV docile infection and core temperature was monitored. n = 4 mice per group. Means ± SEM from one representative of two experiments are shown. *, P < 0.05; **, P < 0.01 (unpaired two-tailed Student’s t test).
Figure 3.
Figure 3.
Perforin and nonhematopoietic H-2Db expression are required for pathology development. (A and B) Core temperatures were measured in WT mice, PD-1 KO mice, and αIFN-γ + αTNF–treated PD-1 KO mice (A) or αIL-6R + αTNF-treated PD-1 KO mice (B) after 106 pfu LCMV docile infection. (C) Core temperatures were monitored in untreated WT and PKOB mice and in αPD-L1–treated WT and PKOB mice after infection. A–C: n = 3–4 mice per group. Means ± SEM from one representative of two experiments are shown. **, P < 0.01 (unpaired two-tailed Student’s t test). (D) WT→WT and WT→H-2Db KO chimeric mice were transferred with 2.5 × 10⁴ PD-1−/− P14 cells, followed by 106 pfu LCMV docile infection and monitoring of core temperature. WT→WT, n = 9 mice per group; WT→H-2Db KO, n = 12 mice per group. Means ± SEM from two pooled experiments are shown. **, P < 0.01 (unpaired two-tailed Student’s t test).
Figure 4.
Figure 4.
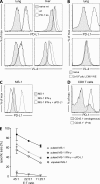
Endothelial PD-L1 expression inhibits CD8 T cell–mediated killing. (A) CD31+CD144+ cells from lungs and livers of naive WT, infected WT, and infected PD-1 KO mice were analyzed for PD-L1 expression and LCMV infection (VL-4 staining) on day 6 after 106 pfu LCMV docile infection. Histograms depict data from one representative of two analyzed mice per group. Data from one representative of three experiments are shown. (B) Lung CD31+CD144+ cells of naive and 102 pfu LCMV WE–infected WT mice were analyzed for PD-L1 expression and LCMV infection (VL-4 staining) on day 6 p.i. Histograms depict data from one mouse each. Data from one representative of two experiments are shown. (C) Untreated, IFN-γ–treated, and IFN-γ + αPD-L1–treated MS-I cells were analyzed for PD-L1 expression and pulsed with GP33+NP396 peptide to serve as target cells in a chromium release assay. (D) PD-1 expression levels of endogenous CD8 T cells and transferred P14 cells were determined on day 6 after systemic infection. C and D: histograms depict data from one representative of two experiments. (E) CD8 T cells were purified from four P14-transferred mice on day 6 p.i. and mixed with chromium-labeled, antigen-pulsed MS-I cells at the indicated effector to target ratios. Chromium release was analyzed in duplicates. Means ± SEM from one representative of three experiments are shown.
Figure 5.
Figure 5.
Pulmonary endothelial cells are driven into apoptosis after systemic LCMV infection. (A) In situ analysis of lung sections from naive and infected WT and PD-1 KO mice on days 5–6 after 106 pfu LCMV docile infection. Representative immunofluorescence stainings with the indicated antibodies are shown. The arrows indicate apoptotic endothelial cells as identified by TUNEL+CD31+ cells. n = 7 mice. Bars, 20 µm. (B) Quantification of CD31+TUNEL+ cells in immunofluorescence stainings of pulmonary vessels on day 5 p.i. Numbers of CD31+TUNEL+ cells were normalized to vessel areas and two to three sections per mouse were considered for quantification. WT, n = 4 mice; wt αPD-L1, n = 4 mice; PD-1 KO, n = 3 mice; PKOB, n = 3 mice; PKOB αPD-L1, n = 3 mice. Means ± SEM from two pooled experiments are shown. n.s.: not significant. (C) Total numbers of lung CD31+CD144+ cells were determined in naive and infected WT and αPD-L1–treated WT mice on day 6 p.i. n = 5–6 mice per group. Means ± SEM from two pooled experiments are shown. *, P < 0.05; **, P < 0.01 (unpaired two-tailed Student’s t test).
Figure 6.
Figure 6.
PD-1 KO mice exhibit systemically increased vascular permeability. (A) EB was injected i.v. to WT and PD-1 KO mice on day 6 after 106 pfu LCMV docile infection and EB extravasation was analyzed in the kidney, liver, lung, and brain. The mean EB concentration in organs of WT mice was normalized to 1. Values in PD-1 KO mice were calculated accordingly. WT, n = 10 mice; KO, n = 5–6 mice. Means ± SEM from three pooled experiments are shown. (B) Photos of PBS-perfused lung lobes from WT and PD-1 KO mice were taken after EB injection on day 6 after infection. Photos from representative mice from one of two experiments are shown. (C) TAT plasma concentrations were determined in naive WT and PD-1 KO mice and infected WT, αPD-L1–treated WT, and PD-1 KO mice on day 6 p.i. Infected, n = 3–4 mice per group; naive, n = 1 mouse per group. Means ± SEM from one representative of two experiments are shown. (D) Total numbers of blood platelets were determined in WT and PD-1 KO mice on day 6 after infection. n = 2–4 mice per group. Means ± SEM from one representative of two experiments are shown. (E) EB extravasation was determined in the kidney, liver, and lung of infected WT, PD-1 KO, and αIL-6R + αTNF–treated PD-1 KO mice on day 6 after systemic infection. n = 6–8 mice per group. Means ± SEM from two pooled experiments are shown. (F) EB extravasation was analyzed in the kidney, liver, and lung of untreated WT and PKOB mice and αPD-L1–treated WT and PKOB mice on day 6 p.i. n = 6–8 mice per group. Means ± SEM from two pooled experiments are shown. n.s.: not significant. (G) EB extravasation was analyzed in the lungs of 2.5 × 10⁴ PD-1−/− P14 cell-transferred WT→WT and WT→H-2Db KO chimeric mice on day 6 p.i. WT→WT, n = 7 mice per group; WT→H-2Db KO, n = 12 mice per group. Means ± SEM from two pooled experiments are shown. *, P < 0.05; **, P < 0.01 (unpaired two-tailed Student’s t test).
Figure 7.
Figure 7.
PD-1 KO mice develop pulmonary edema and severe hypotension. (A) Wet/dry weight ratios of whole lungs from WT and PD-1 KO mice were determined on day 6 after 106 pfu LCMV docile infection. n = 3–4 mice per group. Means ± SEM from one representative of two experiments are shown. (B and C) Total protein concentrations (B) and albumin concentrations (C) were determined in the BAL supernatant of naive and infected WT and PD-1 KO mice on day 6 p.i. Infected, n = 6–7 mice per group; naive, n = 1 mouse per group. Means ± SEM from two pooled experiments are shown. (D and F) Photos were taken of nonperfused, PFA-fixed lung lobes (D) and H&E-stained lung sections (F) from WT and PD-1 KO mice on day 6 after infection. Photos from representative mice from one of two experiments are shown. Bars, 150 µm. (E) Albumin concentrations were determined in the BAL supernatant of untreated and αPD-L1–treated WT and PKOB mice on day 6 p.i. Treated, n = 7–8 mice per group; untreated, n = 3 mice per group. Means ± SEM from two pooled experiments are shown. (G) O2 saturation and lactate concentration in arterial blood were measured in WT and PD-1 KO mice on day 6 p.i. n = 4 mice per group. Means ± SEM from one representative of two experiments are shown. n.s.: not significant. (H) Mean arterial blood pressure was determined in WT and PD-1 KO mice on day 6 p.i. n = 4 mice per group. Means ± SEM from one representative of two experiments are shown. (I) Blood pressure was determined in WT, αPD-L1–treated WT, PD-1 KO, and CD8 T cell–depleted PD-1 KO mice between days 4 and 6 after infection. n = 4 mice per group. Means ± SEM are shown. **, P < 0.01 (unpaired two-tailed Student’s t test).

References

    1. Altman J.D., Moss P.A., Goulder P.J., Barouch D.H., McHeyzer-Williams M.G., Bell J.I., McMichael A.J., Davis M.M. 1996. Phenotypic analysis of antigen-specific T lymphocytes. Science. 274:94–96 10.1126/science.274.5284.94 - DOI - PubMed
    1. Araki K., Gangappa S., Dillehay D.L., Rouse B.T., Larsen C.P., Ahmed R. 2010. Pathogenic virus-specific T cells cause disease during treatment with the calcineurin inhibitor FK506: implications for transplantation. J. Exp. Med. 207:2355–2367 10.1084/jem.20100124 - DOI - PMC - PubMed
    1. Barber D.L., Wherry E.J., Masopust D., Zhu B., Allison J.P., Sharpe A.H., Freeman G.J., Ahmed R. 2006. Restoring function in exhausted CD8 T cells during chronic viral infection. Nature. 439:682–687 10.1038/nature04444 - DOI - PubMed
    1. Barber D.L., Mayer-Barber K.D., Feng C.G., Sharpe A.H., Sher A. 2011. CD4 T cells promote rather than control tuberculosis in the absence of PD-1-mediated inhibition. J. Immunol. 186:1598–1607 10.4049/jimmunol.1003304 - DOI - PMC - PubMed
    1. Battegay M., Cooper S., Althage A., Bänziger J., Hengartner H., Zinkernagel R.M. 1991. Quantification of lymphocytic choriomeningitis virus with an immunological focus assay in 24- or 96-well plates. J. Virol. Methods. 33:191–198 10.1016/0166-0934(91)90018-U - DOI - PubMed

Publication types

MeSH terms