. 2012 Dec 17;209(13):2323-30.
doi: 10.1084/jem.20121303. Epub 2012 Dec 10.

Polymerase ε1 mutation in a human syndrome with facial dysmorphism, immunodeficiency, livedo, and short stature ("FILS syndrome")

Affiliations

Polymerase ε1 mutation in a human syndrome with facial dysmorphism, immunodeficiency, livedo, and short stature ("FILS syndrome")

Jana Pachlopnik Schmid et al. J Exp Med. .

Abstract

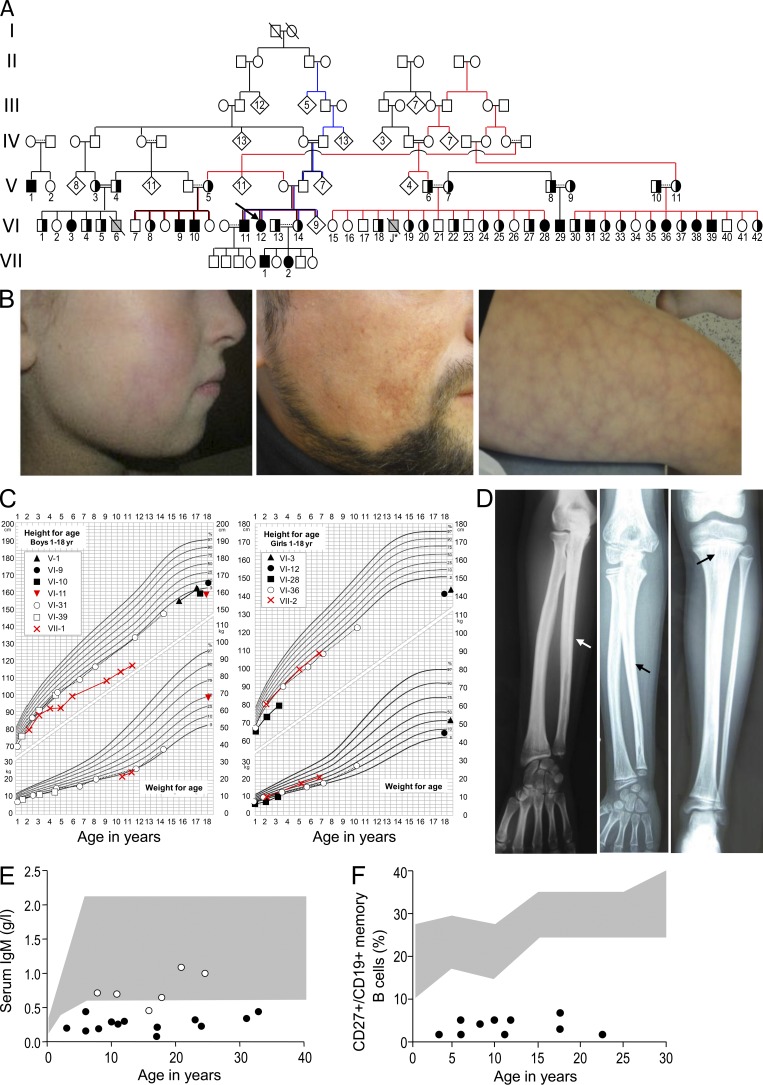
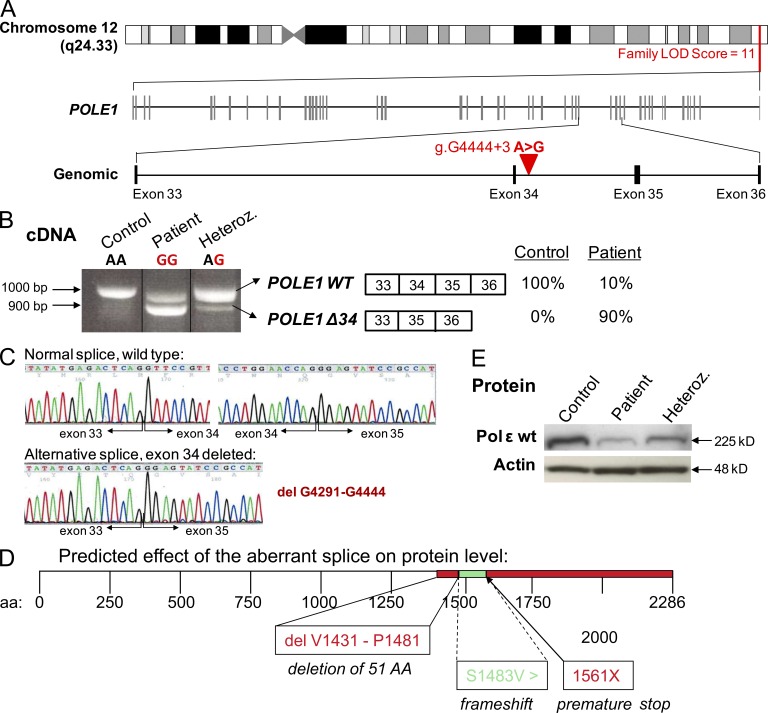
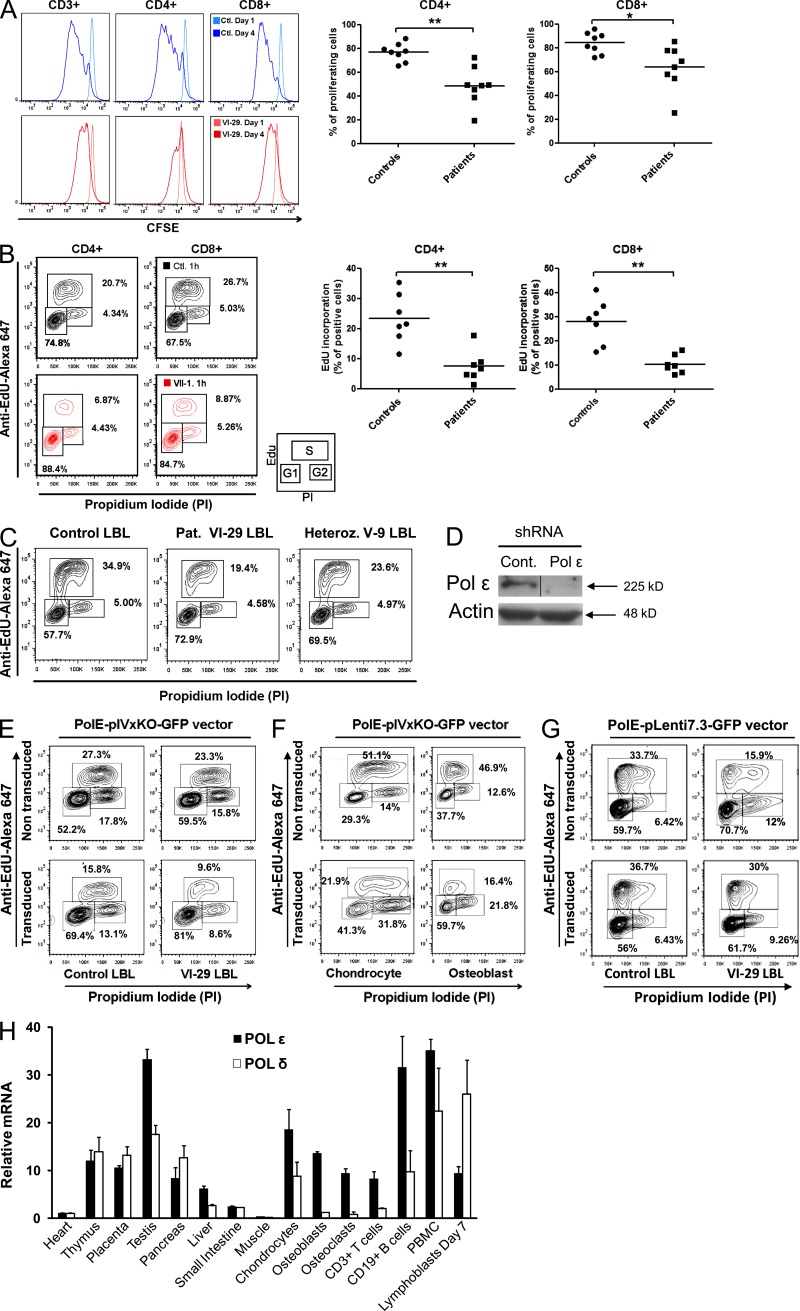
DNA polymerase ε (Polε) is a large, four-subunit polymerase that is conserved throughout the eukaryotes. Its primary function is to synthesize DNA at the leading strand during replication. It is also involved in a wide variety of fundamental cellular processes, including cell cycle progression and DNA repair/recombination. Here, we report that a homozygous single base pair substitution in POLE1 (polymerase ε 1), encoding the catalytic subunit of Polε, caused facial dysmorphism, immunodeficiency, livedo, and short stature ("FILS syndrome") in a large, consanguineous family. The mutation resulted in alternative splicing in the conserved region of intron 34, which strongly decreased protein expression of Polε1 and also to a lesser extent the Polε2 subunit. We observed impairment in proliferation and G1- to S-phase progression in patients' T lymphocytes. Polε1 depletion also impaired G1- to S-phase progression in B lymphocytes, chondrocytes, and osteoblasts. Our results evidence the developmental impact of a Polε catalytic subunit deficiency in humans and its causal relationship with a newly recognized, inherited disorder.


Figures

Figure 1.
Figure 1.
Pedigree and clinical manifestations in patients with the FILS phenotype. (A) Pedigree of the family with FILS. Family members having provided DNA are numbered. Completely closed symbols indicate affected individuals, and half closed symbols indicate a heterozygous carrier. An arrow designates the index case. Individuals clustered in a diamond symbol in generation IV and V were not analyzed. Gray symbols indicate patients that did not undergo genetic testing. Slashes indicate deceased persons, double horizontal lines consanguinity, and dotted lines presumed interrelations. Case J* died after a pulmonary infection at the age of 2 yr. (B) Facial profile photographs showing patient VI-36 at the age of 9, with livedo on the cheek and discrete malar hypoplasia (left), telangiectasia on the cheek of patient VI-11 at the age of 33 (middle) and, lastly, livedo on the thigh of patient VI-11 (right). (C) Growth charts for male (left) and female (right) patients, showing short stature in all instances and particularly substantial growth impairment in patients VI-3, VI-10, VI-11, VI-12, VI-28, and VII-1. (D) X ray of the forearm of case VI-3 (left) and patient VI-29 (middle) showing irregular diaphyseal hyperostosis (arrows) and x-ray of the leg of patient VI-29 (right) showing irregular diaphyseal hyperostosis and metaphyseal striations (arrow). (E) IgM levels in patients (closed dots) and heterozygous individuals (open dots) of different ages. The shaded area indicates our in-house normative values. (F) Percentages of memory B cells (CD27+/CD19+) in patients (closed dots). The shaded area indicates normal level from in-house control values.
Figure 2.
Figure 2.
Homozygous single base pair substitution in POLE1. (A) Schematic representation of the candidate interval on the long arm of chromosome 12 defined by linkage analysis and the intronic nucleotide substitution (g.G4444+3 A>G) between exons 34 and 35. (B) At the cDNA level, the mutation results in two distinct POLE1 transcripts, a WT transcript (POLE1 WT) and a transcript deleted of exon 34 (POLE1 Δ34), accounting for 10% and 90% of the POLE1 transcript expressed in patients cells, respectively. (C) Electropherograms of POLE1 cDNA obtained by sequencing the upper and lower bands, highlighting the exon 34 deletion in the lower band (bottom left). (D) Schematic representation of the predicted effect of the aberrant splice on the Pole1 protein. The intronic mutation results in an alternative splice, which deletes 51 aa in the WT protein leading to frameshift and premature stop codon at position 1561. (E) Polε1 protein levels in LBLs from a FILS patient (VI-29) and a heterozygous individual (V-9) compared with a control subject. Actin was used as a loading control. This Western blot is representative of three experiments.
Figure 3.
Figure 3.
Impaired proliferation and cell cycle kinetics in Polε1-deficient cells. (A) Proportions of proliferating CD4+ and CD8+ T cells at day 4 after CFSE labeling and OKT3/IL-2 stimulation. Each point represents one patient (*, P < 0.05; **, P < 0.005). (B) Quantification of EdU incorporation by CD4+ and CD8+ T cells obtained from controls and FILS patients. Each point represents one patient (**, P < 0.005). The cell cycle was measured by EdU incorporation and propidium iodide labeling of cells cultured for 5 d after stimulation with aCD3/CD28 beads. Cells were labeled with EdU for 1 h before fluorescence-activated cell sorting analysis. Cells in the G1 phase enter early S phase (2N) and progress to late S phase (4N) and G2 phase. Gates defined the percentage of cells in G1, S (EdU positive), and G2 phases, as presented in the inset. (A and B) Horizontal lines indicate the mean. (C) Cell cycle distribution of LBLs from patient VI-29, his parent (V-9), and a control. Data are representative of five independent experiments. (D) Polε1 protein levels in LBLs transfected with specific shRNA targeting POLε1 or control shRNA. Actin was used as loading control. The black line indicates that intervening lanes have been spliced out. (E) Effect of depleting POLε1 by specific shRNA (PolE-plVxKO-GFP vector) on the accumulation of cells in G1 phase in LBLs from a FILS patient and a control. The cell cycle in LBLs was measured by EdU incorporation after 72 h of transduction with specific shRNA (PolE-plVxKO-GFP vector). (F) Effect of depleting POLε1 by specific shRNA (PolE-plVxKO-GFP vector) on the cell cycle progression (as measured by EdU incorporation) in SV40-TAg–chondrocytes and SV40-TAg–osteoblasts. (G) Complementation of cell cycle progression by lentiviral transduction of LBLs from a FILS patient (VI-29) with WT POLE1 (PolE-pLenti7.3-GFP vector) as compared with nontransduced cells in the same experiment. Data are representative of three independent experiments. (H) Relative amounts of POLE and POLD transcript levels in different tissues, as measured by quantitative RT-PCR and normalized against the housekeeping gene GAPDH. Values represent mean ± SD calculated from two independent experiments.

References

    1. Albertson T.M., Ogawa M., Bugni J.M., Hays L.E., Chen Y., Wang Y., Treuting P.M., Heddle J.A., Goldsby R.E., Preston B.D.. 2009. DNA polymerase epsilon and delta proofreading suppress discrete mutator and cancer phenotypes in mice. Proc. Natl. Acad. Sci. USA. 106:17101–17104. 10.1073/pnas.0907147106 - DOI - PMC - PubMed
    1. Benoist-Lasselin C., Gibbs L., Heuertz S., Odent T., Munnich A., Legeai-Mallet L.. 2007. Human immortalized chondrocytes carrying heterozygous FGFR3 mutations: an in vitro model to study chondrodysplasias. FEBS Lett. 581:2593–2598. 10.1016/j.febslet.2007.04.079 - DOI - PubMed
    1. Bermudez V.P., Farina A., Raghavan V., Tappin I., Hurwitz J.. 2011. Studies on human DNA polymerase epsilon and GINS complex and their role in DNA replication. J. Biol. Chem. 286:28963–28977. 10.1074/jbc.M111.256289 - DOI - PMC - PubMed
    1. Braegger C., Jenni O., Konrad D., Molinari L.. 2011. Neue Wachstumskurven für die Schweiz. Paediatrica. 1:9–11.
    1. Chabbi-Achengli Y., Coudert A.E., Callebert J., Geoffroy V., Côté F., Collet C., de Vernejoul M.C.. 2012. Decreased osteoclastogenesis in serotonin-deficient mice. Proc. Natl. Acad. Sci. USA. 109:2567–2572. 10.1073/pnas.1117792109 - DOI - PMC - PubMed

Publication types

MeSH terms

Substances