. 2013 Mar 1;207(5):721-9.
doi: 10.1093/infdis/jis745. Epub 2012 Dec 10.

Age- and sex-specific mortality associated with the 1918-1919 influenza pandemic in Kentucky

Affiliations

Age- and sex-specific mortality associated with the 1918-1919 influenza pandemic in Kentucky

Cécile Viboud et al. J Infect Dis. .

Abstract

Background: The reasons for the unusual age-specific mortality patterns of the 1918-1919 influenza pandemic remain unknown. Here we characterize pandemic-related mortality by single year of age in a unique statewide Kentucky data set and explore breakpoints in the age curves.

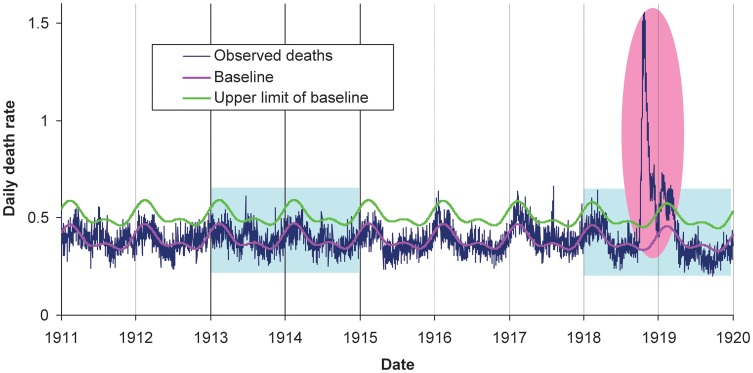
Methods: Individual death certificates from Kentucky during 1911-1919 were abstracted by medically trained personnel. Pandemic-associated excess mortality rates were calculated by subtracting observed rates during pandemic months from rates in previous years, separately for each single year of age and by sex.

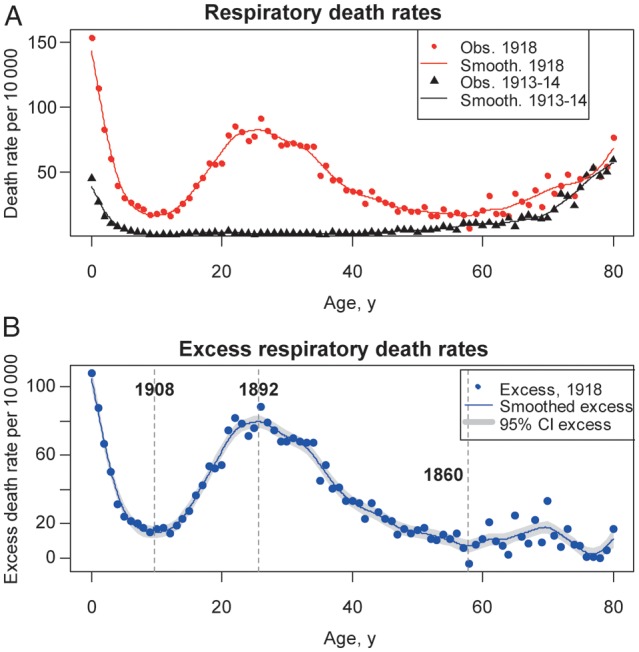
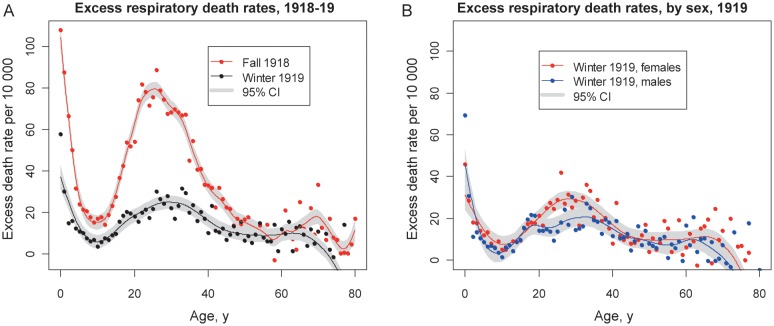
Results: The age profile of excess mortality risk in fall 1918 was characterized by a maximum among infants, a minimum at ages 9-10 years, a maximum at ages 24-26 years, and a second minimum at ages 56-59 years. The excess mortality risk in young adults had been greatly attenuated by winter 1919. The age breakpoints of mortality risk did not differ between males and females.

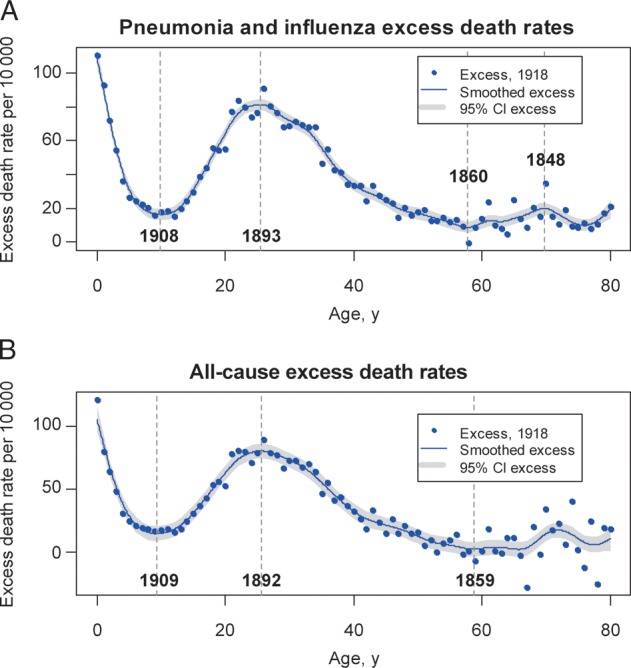
Conclusions: The observed mortality breakpoints in male and female cohorts born during 1859-1862, 1892-1894, and 1908-1909 did not coincide with known dates of historical pandemics. The atypical age mortality patterns of the 1918-1919 pandemic cannot be explained by military crowding, war-related factors, or prior immunity alone and likely result from a combination of unknown factors.


Figures

Figure 1.
Figure 1.
Daily time series of all-cause death rate in Kentucky, 1911–1919, showing observed death rates (blue line), baseline death rate predicted by seasonal regression (pink line), and upper limit of the 95% confidence interval on the predicted baseline (green line). Light blue shaded areas represent years for which cause-specific deaths were coded and digitized. The pink shaded area represents the main influenza pandemic period, September 1918–March 1919.
Figure 2.
Figure 2.
Age-specific respiratory mortality in Kentucky in the fall 1918 pandemic wave and in baseline periods. A, Observed respiratory death rates, by single year of age, during October–December 1918 (red dots) and during the baseline months of October–December 1913–1914 (black triangles). Solid lines represent smoothing splines. B, Age-specific excess respiratory death rates, calculated as observed (1918) minus baseline (1913–1914). The blue dots represent excess death rates estimates; the blue solid line is a smoothing spline of the estimated excess rates, and the grey-shaded areas are 95% confidence intervals (CIs) on the splines. Vertical grey bars mark the age breakpoints (ie, extrema) and associated birth years identified in the mortality age risk.
Figure 3.
Figure 3.
Age-specific excess mortality rates from pneumonia and influenza and from all causes in the fall 1918 pandemic wave, Kentucky. Excess death rates are calculated as observed death rates during October–December 1918 minus baseline death rates during October–December 1913–1914, by single year of age, as in Figure 2. The blue dots represent excess death rates, the blue solid line is a smoothing spline of the excess death rates, and the grey-shaded areas are 95% confidence intervals (CIs) on the splines. Vertical grey bars mark the age breakpoints (ie, extrema) and associated birth years identified in the mortality age risk.
Figure 4.
Figure 4.
Age- and sex-related differences in excess respiratory mortality during the October–December 1918 pandemic wave in Kentucky. Dots represent excess death rates, lines are smoothing splines of the excess rates, and grey-shaded areas are 95% confidence intervals (CIs). Vertical grey bars mark the age breakpoints (ie, extrema) and associated birth years identified in the mortality age curves. A, Female-specific excess respiratory death rates by single year of age during fall 1918. B, Male-specific excess respiratory death rates during fall 1918. Blue dots represent estimates based on the entire mortality database, whereas red dots represent estimates after exclusion of deaths among Kentucky male military personnel who were not Kentucky residents. Similar curves excluding military populations are presented in Supplementary Figure 2.
Figure 5.
Figure 5.
Comparison of age- and sex-specific excess respiratory mortality rates associated with the fall 1918 and winter 1919 pandemic waves in Kentucky. Dots represent excess respiratory death rates, solid lines are smoothing splines of the excess respiratory death rates, and grey-shaded areas represent 95% confidence intervals (CIs). A, Comparison of age patterns in fall 1918 (red) and winter 1919 (black) pandemic waves (October–December 1918 vs January–March 1919). B, Sex-specific differences during the winter 1919 pandemic wave (blue, males; red, females).
Figure 6.
Figure 6.
Comparison of the age patterns of influenza-related deaths during the fall 1918 pandemic in Kentucky and the 2009 pandemic in the United States. Mortality rates for the 2009 pandemic (red curve) are based on reports of laboratory-confirmed deaths in US states during August 2009–March 2010 [49]. Mortality rates for the 1918 pandemic (blue curve) are based on excess respiratory deaths in Kentucky, subtracting observed death rates during October–December 1918 from observed death rates during the same months of baseline years 1913–1914.

Comment in

References

    1. Johnson NP, Mueller J. Updating the accounts: global mortality of the 1918–20 “Spanish” influenza epidemic. Bull Hist Med. 2002;76:105–15. - PubMed
    1. Murray CJ, Lopez AD, Chin B, Feehan D, Hill KH. Estimation of potential global pandemic influenza mortality on the basis of vital registry data from the 1918–20 pandemic: a quantitative analysis. Lancet. 2006;368:2211–8. - PubMed
    1. Miller MA, Viboud C, Balinska M, Simonsen L. The signature features of influenza pandemics—implications for policy. N Engl J Med. 2009;360:2595–8. - PubMed
    1. Andreasen V, Viboud C, Simonsen L. Epidemiologic characterization of the 1918 influenza pandemic summer wave in Copenhagen: implications for pandemic control strategies. J Infect Dis. 2008;197:270–8. - PMC - PubMed
    1. Jordan EO. Epidemic influenza. Chicago: American Medical Association; 1927.

Publication types