. 2012 Nov;235(5):971-980.
doi: 10.1007/s00217-012-1827-3.

Single nucleotide polymorphisms (SNPs) in key cytokines may modulate food allergy phenotypes

Affiliations

Single nucleotide polymorphisms (SNPs) in key cytokines may modulate food allergy phenotypes

Paula Brown et al. Eur Food Res Technol. 2012 Nov.

Abstract

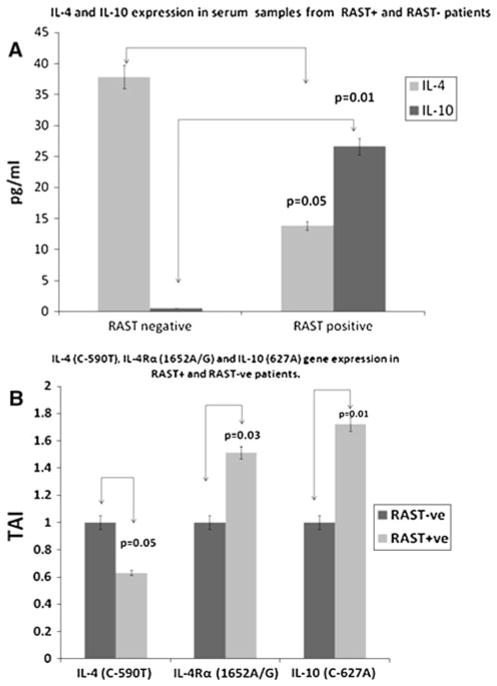
Single nucleotide polymorphisms (SNPs) can play a direct or indirect role in phenotypic expression in food allergy pathogenesis. Our goal was to quantitate the expression of SNPs in relevant cytokines that were expressed in food allergic patients. SNPs in cytokine genes IL-4 and IL-10 are known to be important in IgE generation and regulation. We examined IL-4 (C-590T), IL-4Rα (1652A/G) and IL-10 (C-627A) SNPs using real-time PCR followed by restriction fragment length polymorphism (RFLP) analysis. Our results show that the AA, AG and GG genotypes for IL-4Rα (1652A/G) polymorphisms were statistically different in radioallergosorbent test (RAST) positive versus negative patients, and although no statistically significant differences were observed between genotypes in the IL-4 (C-590T) and IL-10 (C-627A) SNPs, we observed a significant decrease in IL-4 (C-590T) gene expression and increase in IL-4Rα (1652A/G) and IL-10 (C-627A) gene expression between RAST(+) versus RAST(-) patients, respectively. We also observed significant modulation in the protein expression of IL-4 and IL-10 in the serum samples of the RAST(+) patients as compared to the RAST(-) patients indicating that changes in SNP expression resulted in altered phenotypic response in these patients.


Figures

Fig. 1
Fig. 1
Comparison of IL-4 (C-590T) genotypes in RAST+ versus RAST patients. a A representative gel image showing IL-4 (C-590T) genotype analysis comparing the TT, CT and CC genotypes of RAST+ and RAST patients. Lane 1 Uncut DNA; Lane 2 Cut DNA with TT genotype; Lane 3 Uncut DNA; Lane 4 Cut DNA with CT genotype; Lane 5 Uncut DNA; Lane 6 Cut DNA with CC genotype; Lane 7 100 bp marker. b Graphical representation of the results showing higher expression of the TT genotype in the RAST + versus RAST patients. Data shown are mean ± SD from duplicate samples
Fig. 2
Fig. 2
Comparison of IL-4Rα (1652A/G) genotypes in RAST+ versus RAST patients. a A representative gel showing IL-4Rα (1652A/G) genotype analysis where comparisons were made between the AA, AG and GG genotypes of the RAST+ and RAST patients. Lane 1 Uncut DNA; Lane 2 Cut DNA with AG genotype; Lane 3 Uncut DNA; Lane 4 Cut DNA with AA genotype; Lane 5 100 bp marker. b Graphical representation of the results showing statistically significant differences in expression of AA and AG genotypes between RAST+ and RAST patients. Data shown are mean ± SD from duplicate samples
Fig. 3
Fig. 3
Comparison of IL-10 (−627C/A) genotypes in RAST+ versus RAST patients. a A representative gel showing IL-10 (−627C/A) genotype analysis where comparisons were made between the CC, AC and AA genotypes of the RAST+ and RAST patients. Lane 1 Uncut DNA; Lane 2 Cut DNA with AC genotype; Lane 3 Uncut DNA; Lane 4 Cut DNA with AA genotype; Lane 5 Uncut DNA; Lane 6 Cut DNA with CC genotype; Lane 7 100 bp marker. b Graphical representation of the results showing no statistically significant differences in expression of CC, AC and AA between the RAST positive and the RAST negative groups. Data shown are mean ± SD from duplicate samples
Fig. 4
Fig. 4
a Graphical representation of IL-4 and IL-10 protein expression in serum samples of RAST+ versus RAST patients as measured by ELISA. Our results show a significant decrease in IL-4 production and a significant increase in IL-10 production in RAST+ patients as compared to RAST patients. b IL-4 (C-590T), IL-4Rα (1652A/G) and IL-10 (−627A) gene expression in RAST+ versus RAST patients as quantitated by QPCR. SNP expression analysis of IL-4 (C-590T), IL-4Rα (1652A/G) and IL-10 (−627A) was done in DNA extracted from blood of RAST+ and RAST subjects. Both data are the mean ± SD of 3 separate experiments done in duplicate. Statistical significance was determined by Student’s t-test

References

    1. Branum AM, Lukacs SL. Food allergy among U.S. children: trends in prevalence and hospitalizations. NCHS Data Brief. 2008;10:1–8. - PubMed
    1. Sicherer SH, Wood RA American Academy of Pediatrics Section On A, Immunology. Allergy testing in childhood: using allergen-specific IgE tests. Pediatrics. 2012;129(1):193–197. doi: 10.1542/peds.2011–2382. - DOI - PubMed
    1. Mahoney EJ, Veling MC, Mims JW. Food allergy in adults and children. Otolaryngol Clin N Am. 2011;44(3):815–833. xii. doi: 10.1016/j.otc.2011.03.014. - DOI - PubMed
    1. Sicherer SH, Leung DY. Advances in allergic skin disease, anaphylaxis, and hypersensitivity reactions to foods, drugs, and insects in 2011. J Allergy Clin Immunol. 2012;129(1):76–85. doi: 10.1016/j.jaci.2011.11.016. - DOI - PubMed
    1. Wang J, Sampson HA. Food allergy. J Clin Investig. 2011;121(3):827–835. doi: 10.1172/JCI45434. - DOI - PMC - PubMed

LinkOut - more resources