. 2012:3:1271.
doi: 10.1038/ncomms2236.

Receptor tyrosine kinase ErbB2 translocates into mitochondria and regulates cellular metabolism

Affiliations

Receptor tyrosine kinase ErbB2 translocates into mitochondria and regulates cellular metabolism

Yan Ding et al. Nat Commun. 2012.

Abstract

It is well known that ErbB2, a receptor tyrosine kinase, localizes to the plasma membrane. Here we describe a novel observation that ErbB2 also localizes in mitochondria of cancer cells and patient samples. We found that ErbB2 translocates into mitochondria through association with mtHSP70. Additionally, mitochondrial ErbB2 (mtErbB2) negatively regulates mitochondrial respiratory functions. Oxygen consumption and activities of complexes of the mitochondrial electron transport chain were decreased in mtErbB2-overexpressing cells. Mitochondrial membrane potential and cellular ATP levels were also decreased. In contrast, mtErbB2 enhanced cellular glycolysis. The translocation of ErbB2 and its impact on mitochondrial function are kinase dependent. Interestingly, cancer cells with higher levels of mtErbB2 were more resistant to the ErbB2-targeting antibody trastuzumab. Our study provides a novel perspective on the metabolic regulatory function of ErbB2 and reveals that mtErbB2 has an important role in the regulation of cellular metabolism and cancer cell resistance to therapeutics.


Conflict of interest statement

Competing financial interests: The authors declare no competing financial interests.

Figures

Fig. 1
Fig. 1
Localization of ErbB2 in mitochondria. (A) Cytosolic, nuclear, mitochondrial, and plasma membrane proteins were isolated and subjected to SDS-PAGE followed by probing with indicated antibodies. Two exogenous ErbB2 overexpressing breast cancer cell lines MCF7/ErbB2 and MDA-MB-231 (left), and two natural ErbB2-positive breast cancer cell lines SKBR3 and BT474 (right) were used for Western Blotting. VDAC1 and prohibitin were mitochondrial markers; Integrin β1 and IGF1Rα were plasma membrane markers; α-Tubulin and ERK were cytoplasmic markers; KDEL was an ER marker; EEA1 was an early endosomes marker; Golgi complex was a marker for the detection of Golgi; LAMP2 was an lysosome marker and Lamin B1 was a nucleus marker. (B) MCF7 cells, mouse heart and liver tissues, and ErbB2 positive and negative breast cancer patient samples were analyzed by Western blotting. (C) Co-localization of ErbB2 and mitochondria. Mitochondria were stained with Mitotracker-Green in ErbB2 transfected MCF7 cells. The cells were fixed and incubated with antibodies against ErbB2 (mouse), followed by incubation of monoclonal mouse Anti–Cy3 antibody (red). Images were analyzed with Nikon NIS-Elements AR software. Green: mitochondria; Red: ErbB2; Yellow: Co-localization of ErbB2 and mitochondria. The lower panel contains images with a higher magnification. Scale bars: 20 μm. (D) Localization of ErbB2 inside mitochondria. Intact mitochondria of SKBR3 cells were isolated and treated with Protease K at 0.5 mg/ml for 15 min at room temperature. 1% Triton was added into the reaction and 2 mM PMSF was added to stop the reaction. Each reaction was started with an equal amount/volume of mitochondria lysate. Mitochondrial lysate then was loaded onto 8% SDS PAGE followed by blotting with anti-ErbB2, anti-BCL-2 and anti-Prohibitin antibodies.
Fig. 2
Fig. 2
Analysis of the mechanisms of mtErbB2 mitochondrial localization. (A) MCF7 breast cancer cells were transfected with plasmids encoding either GFP alone, or GFP fused ErbB2 fragments GFP-646–689, GFP-623–645 or GFP-623–689. Cells were cultured and the florescent imaging was done as described under the “Methods.” Scale bars: 20 μm. (B) MDA-MB-231 cells were transfected with wild-type ErbB2 and ErbB2ΔMTS vectors and mitochondrial proteins were extracted. ErbB2 expression was measured by Western blotting analysis; α-Tubulin and mtHSP70 were loading controls. (C) Mitochondrial proteins were isolated from MDA-MB-231ErbB2 cells and immunoprecipitated with ErbB2 antibody. The immunoprecipitates were probed with anti-mtHSP70 and anti-ErbB2 (top left). Mitochondrial proteins from the same cells were precipitated with mtHSP70 antibody and the immunoprecipitates were probed with anti-mtHSP70 and anti-ErbB2 (top right). IgG was used as a negative control. Isolated mitochondrial proteins (input) were loaded as a positive control. Similar results were obtained using another breast cancer cell line, SKBR3 (bottom). (D) siRNA specific to mtHSP70 was transfected into MDA-MB-231ErbB2 cells. The cytoplasmic fraction (Cyto), mitochondrial fraction (Mito) and whole cell lysate (WCL) were separated for western blotting analysis (left). Cytochrome c oxidase subunit II and α-Tubulin were makers and loading controls for the mitochondrial fraction and the cytoplasmic fraction, respectively. The relative protein amounts of ErbB2 and mtHSP70 were calculated by determining the intensity of the protein bands followed by the normalization with loading controls (right). Experiments were repeated three times. Columns, mean of three independent experiments; bars, SE.
Fig. 3
Fig. 3
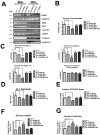
MtErbB2 reprograms cellular metabolism from oxidative phosphorylation toward glycolysis. (A) Mitochondrial and whole cell lysate of 231V, 231ErbB2WT, 231ErbB2Mito, and 231ErbB2ΔMTS cells were isolated and analyzed by Western blotting. Protein amounts of each fraction loaded: mitochondria: 10 ug; whole cell lysate: 30 ug. Integrin β1 was used as plasma membrane maker and loading control; mtHSP70 was a mitochondrial maker and loading control; α-Tubulin was a cytoplasm maker; KDEL was an ER marker; EEA1 was an early endosomes marker; Golgi Complex was a marker for the detection of Golgi; LAMP2 was an lysosome marker and Lamin B1 was a nucleus marker. (B) Oxygen consumption rates. Oxygen consumption rates of 231V, 231ErbB2WT, 231ErbB2Mito, 231ErbB2ΔMTS and 231ErbB2MitoKM cells were measured. The oxygen consumption rate was calculated on the basis of the maximal rate of change in relative fluorescence units (DFU/second). (C) Activities of the mitochondrial electron transport chain complexes in 231V, 231ErbB2WT, 231ErbB2Mito, 231ErbB2ΔMTS and 231ErbB2MitoKM cells. Activities are presented as milliunits of O.D. value per min and were normalized by the amounts of the mitochondrial proteins. (D) Mitochondrial membrane potential (ΔΨm) of 231V, 231ErbB2WT, 231ErbB2Mito, 231ErbB2ΔMTS and 231ErbB2MitoKM cells was detected using JC-1 staining. The aggregate form of JC-1 staining represents healthy mitochondria. (E) The cellular ATP/ADP ratio of 231V, 231ErbB2WT, 231ErbB2Mito, 231ErbB2ΔMTS and 231ErbB2MitoKM cells were detected. (F) MtErbB2 increased glucose uptake. 231V, 231ErbB2WT, 231ErbB2Mito, 231ErbB2ΔMTS and 231ErbB2MitoKM cells were cultured in medium containing 10% fetal bovine serum (FBS) and the glucose uptake were measured. Data are shown as a percentage relative to MDA-MB-231V. (G) MtErbB2 increased lactate production. 231V, 231ErbB2WT, 231ErbB2Mito, 231ErbB2ΔMTS and 231ErbB2MitoKM cells were cultured in medium containing 10% FBS and the lactate production in the medium was measured. Data are shown as a percentage relative to 231V. Columns, mean of three independent experiments; bars, SE. *, P<0.05, **, P<0.01, ***, P < 0.001.
Fig. 4
Fig. 4
MtErbB2 renders cancer cells sensitive to glycolysis inhibitors but resistant to hypoxia and ETS inhibitors. (A) 231V, 231ErbB2WT, 231ErbB2Mito, 231ErbB2ΔMTS and 231ErbB2MitoKM cells were treated with Oligomycin at 16 ug/ml for 20 h; Oxamate at 20 uM for 48 h; 2-DG at 10 mM for 48 h and PBS as control. Morphological changes were observed using a microscope (200×). (B) Indicated cells were treated with Oligomycin at 16 ug/ml for 22 h; Oxamate at 20 uM for 48 h and 2-DG at 10 mM for 48 h. Direct cell counting was conducted for Oxamate treatment. Apoptosis for Oligomycin and 2-DG treatments was detected using the Cell Death Detection ELISA PLUS Kit. The fold induction value was calculated following the formula: mU of the sample (cells treated)/mU of the corresponding negative control (cells without treatment). (C) Oxygen consumption rates of non-treated and CoCl2 treated 231V, 231ErbB2WT, 231ErbB2Mito, 231ErbB2ΔMTS and 231ErbB2MitoKM cells. The oxygen consumption rate was calculated on the basis of the maximal rate of change in relative fluorescence units (DFU/second) (top). Cells were cultured in medium containing 10% fetal bovine serum (FBS), glucose uptake (middle) and lactate production (bottom) of non-treated and CoCl2 treated cells were measured. Data are shown as a percentage relative to 231V cells. Columns, mean of three independent experiments; bars, SE. *, P<0.05, **, P<0.01, ***, P < 0.001.
Fig. 5
Fig. 5
Translocation of ErbB2 into mitochondria contributes to trastuzumab resistance. (A) mtErbB2 is elevated in trastuzumab-resistant cancer cells. Mitochondrial proteins and whole cell lysates of BT474 and BT474 trastuzumab-resistant cells (BT474 HCP R) were isolated and analyzed by Western blotting. ATP Synthase and α-Tubulin were used as loading controls. (B) BT474 cells were treated with trastuzumab (HCP) at 10 ug/ml for 24 h and 48 h followed by the separation of cytosolic and mitochondrial fractions. Proteins from the cytoplasm, mitochondria and whole cell lysates were loaded onto gels and analyzed by Western blotting. mtHSP70 and α-Tubulin were used as loading controls (left). The relative protein amount of ErbB2 in the cellular fractions was calculated by detecting the intensity of the protein bands followed by normalization with loading controls (right). The experiments were repeated for three times. (C) mtErbB2-overexpressing cells are more resistant to trastuzumab. 231ErbB2WT, 231ErbB2Mito, 231ErbB2ΔMTS, 231ErbB2MitoKM and 231ErbB2WT cells transfected by siRNA to mtHSP70 were treated with trastuzumab at 100 ug/ml for 48 h and 72 h. The cell growth inhibition ratios were detected by a CellTiter 96 Aqueous One Solution Cell Proliferation Assay Kit. Columns, mean of three independent experiments; bars, SE. *, P<0.05.
Fig. 6
Fig. 6
Translocation of ErbB2 into mitochondria is kinase dependent. (A) The mitochondrial fractions and whole cell lysates were isolated and Western blotting was performed on MDA-MB-435ErbB2 (435eb), MDA-MB-435ErbB2V695E (435VE) and MDA-MB-435ErbB2K753M (435KM) cells. MtHSP70 and α-Tubulin were loading controls. (B) Mitochondrial fractions and whole cell lysates were isolated and Western Blotting was performed to detect mtErbB2 in mitochondria following the treatment of MCF7ErbB2 cells with ErbB2 inhibitor AG825 at 10 uM or control (DMSO) for 24 h; and with Heregulin β1 (HRG) at 10 ng/ml or control (PBS) for 24 h (upper). Whole cell lysates were subjected to Western Blotting to examine the phosphorylation status of ErbB2 and the total ErbB2. α-Tubulin was loading control (lower). (C) MCF7 cells were treated with and without HRG at 10 ng/ml for 24 h. The mitochondrial fraction and the whole cell lysate were isolated for Western blotting. Prohibitin and α-Tubulin were loading controls. (D) Left, mitochondrial proteins were isolated from SKBR3 cells and immunoprecipitated with anti-ErbB2 or anti-Cox II antibodies. The immunoprecipitates were analyzed by Western blotting with anti-ErbB2 and anti-Cox II antibodies. IgG was negative control. Right, mitochondrial proteins were isolated from 231V, 231ErbB2WT, 231ErbB2Mito and 231ErbB2MitoKM cells and immunoprecipited with Cox II antibody or negative control IgG. Samples were loaded on a SDS–PAGE followed by Western Blotting analysis with Cox II antibody to show the Cox II protein level, and with P-Y20 antibody to show the tyrosine phosphorylation level on Cox II. (E) Cytochrome c oxidase activities were measured after the cells were treated with or without a cytochrome c oxidase inhibitor Potassium cyanide (KCN) in 231V, 231ErbB2WT, 231ErbB2Mito and 231ErbB2MitoKM cells. The relative activities of Cox II were calculated relative to the Cox II activity of 231V cells. (F) 231V, 231ErbB2WT, 231ErbB2Mito and 231ErbB2MitoKM cells were treated with or without Taxol at 80 nM for 24 h. Cytosolic, mitochondrial fractions and whole cell lysates were analyzed by Western blotting with cytochrome c antibodies. α-Tubulin and mtHSP70 were cytosol and mitochondrial markers and loading controls. Columns, mean of three independent experiments; bars, SE.*, P < 0.05, **, P < 0.01

Similar articles

Cited by

References

    1. Warburg O. On respiratory impairment in cancer cells. Science. 1956;124:269–270. - PubMed
    1. Kim JW, Dang CV. Cancer’s molecular sweet tooth and the Warburg effect. Cancer Res. 2006;66:8927–30. - PubMed
    1. Chen Z, Lu WQ, Garcia-Prieto C, Huang P. The Warburg effect and its cancer therapeutic implications. J Bioenerg Biomembr. 2007;39:267–274. - PubMed
    1. Gatenby RA, Gillies RJ. Glycolysis in cancer: a potential target for therapy. Int J Biochem Cell Biol. 2007;39:1358–66. - PubMed
    1. DeBerardinis RJ, Lum JJ, Hatzivassiliou G, Thompson CB. The biology of cancer: metabolic reprogramming fuels cell growth and proliferation. Cell Metab. 2008;7:11–20. - PubMed

Publication types

MeSH terms