. 2013 Jan 9;32(1):60-71.
doi: 10.1038/emboj.2012.326. Epub 2012 Dec 11.

Dissecting the mechanisms of Notch induced hyperplasia

Affiliations

Dissecting the mechanisms of Notch induced hyperplasia

Alexandre Djiane et al. EMBO J. .

Abstract

The outcome of the Notch pathway on proliferation depends on cellular context, being growth promotion in some, including several cancers, and growth inhibition in others. Such disparate outcomes are evident in Drosophila wing discs, where Notch overactivation causes hyperplasia despite having localized inhibitory effects on proliferation. To understand the underlying mechanisms, we have used genomic strategies to identify the Notch-CSL target genes directly activated during wing disc hyperplasia. Among them were genes involved in both autonomous and non-autonomous regulation of proliferation, growth and cell death, providing molecular explanations for many characteristics of Notch induced wing disc hyperplasia previously reported. The Notch targets exhibit different response patterns, which are shaped by both positive and negative feed-forward regulation between the Notch targets themselves. We propose, therefore, that both the characteristics of the direct Notch targets and their cross-regulatory relationships are important in coordinating the pattern of hyperplasia.


Conflict of interest statement

The authors declare that they have no conflict of interest.

Figures
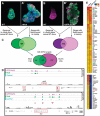
Figure 1
Figure 1
Identification of Notch regulated genes in proliferating epithelial wing imaginal discs cells. (AB′) Wild-type wing discs and hyperplastic discs produced by manipulating Notch activity. (A, A′) Randomly generated clones of cells overexpressing GFP alone (A) or with Nicd (A′) in wing imaginal discs. Clones were marked with GFP (green), and tissue counterstained to detect E-Cadherin (blue) and Wg (red). (B, B′) ptc-Gal4 control (B) or ptc-Gal4 driven GFP:Su(H) fusion protein (green; B′); discs are counterstained with E-Cadherin (purple). (C) Strategy to identify direct Notch targets. Expression arrays were used to identify transcriptionally upregulated genes in the two genotypes (365 in Nicd; 460 in GFP:Su(H)) and ChIP was performed to locate Su(H) bound regions (2833 in Nicd; 4795 in GFP:Su(H)). Genes in the vicinity of ChIP peaks were identified, such that each peak may be associated to more than one gene and genes may be associated to more than one peak, generating a list of all neighbouring genes irrespective of orientation or distance cut-off (more details in Supplementary data). Venn diagrams illustrate the intersection of these two data sets, Assigned Peak Gene (APG) targets, for each genotype (that corresponded to 848 (30%) peaks from Nicd discs and 2232 (46%) peaks from GFP:Su(H)). Lower Venn diagram depicts the overlap between the APG targets from each. (D) Examples of genomic regions from two representative Notch APG targets showing Su(H) enriched regions (enrichment relative to input AvgM, scale log2 0–4) in wing discs from wild type (cyan), Nicd (green), and GFP:Su(H) (purple). Gene models are depicted in black, horizontal numbering indicates genomic coordinates, upregulated genes are boxed in red. Bottom panel: red lines (A: Ser_minimal_wing_enhancer; B: Ser_V-1.9; C: Ser_II-4.2) highlight identified enhancers for Notch regulated expression of Serrate at the D/V boundary (Bachmann and Knust, 1998; Yan et al, 2004). (E) Heat maps illustrating changes in expression of identified APG targets compared to wild type. (Top) Upregulation of common APG targets, ranked according to fold change in Nicd expressing discs; (Bottom) cluster of genes identified by hierarchical clustering that are upregulated in Nicd but downregulated in GFP:Su(H) discs. Genes in cell proliferation GO categories are highlighted in green and BTB/POZ genes are highlighted in red.
Figure 2
Figure 2
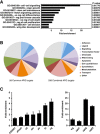
Characteristics and validation of Notch APG targets. (A) GO categories (Biological Process) enriched in the APG targets, ranked by P-values (calculated using a Hypergeometric test with Benjamini correction). Results were filtered for categories with ⩽3-fold enrichment and P-value⩽0.05, overlapping processes were grouped, and the most enriched depicted here. (B) Pie charts depicting proportions of genes with the indicated molecular functions for common APG targets (left) and for combined APG targets. Proportions are broadly similar except that adhesion and meta/catabolism constitute a larger component of the combined set, while ligand and cytoskeleton are commensurably reduced. (C) Fold change in expression levels between Nicd overexpressing discs and control discs for the indicated genes determined by qPCR. Expression levels were normalized to rp49 before calculating the fold change. Error bars indicate standard error of the mean (three biological replicates).
Figure 3
Figure 3
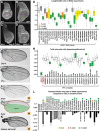
Functions of APG targets downstream of Notch and for wing size. (AD) Third instar wing imaginal discs stained with E-Cadherin (white). (A) Wild-type ptc-Gal4, tubGal80ts/+ wing disc. (B) Wing discs from ptc-Gal4, tubGal80ts driving UAS-Nicd & UAS-GFPRNAi for 60 h at 30°C. (A, B) Green lines indicate the AP length and purple lines the DV width of the wing disc that were measured. The AP length/DV width ratio is 0.77 in wild type (A) and 1.41 in >Nicd (B). (C, D) Wing discs after Nicd overexpression together with RNAi mediated knock-down of esg (C; ratio=1.05) or upd3 (D; ratio=1.14). (E) Effects of RNAi against the indicated genes on Nicd induced hyperplasia. Hyperplasia was quantified by calculating the ratio between the AP length (green line, A, B) and the orthogonal DV width (purple line, A, B). Ratios were calculated for ‘wild-type’ discs (ptc-Gal4, tubGal80ts), control discs (ptc-Gal4, tubGal80ts driving UAS-Nicd and UAS-GFPRNAi; labelled as control) and for discs expressing Nicd together with the different indicated RNAi. Box plot depicts the ratios obtained from wing discs of larvae grown at 30°C for 60 h. Significantly different results (unpaired two-tailed Student’s t-test) are indicated according to the colours in the key. (F, G) Enlarged adult wings from Hairless2 heterozygote (H2/+; G) compared to wings from ORE-R wild type (F). (H) Genetic interactions between APG and Notch pathway measured by effects of reducing gene dose on H/+ wing size. Box plot showing wing sizes from the indicated genotypes as a ratio to H2/+ wings (red rectangle; note that Ore-R wild-type wings, left column, are circa 80% of H2/+). Combinations that differed significantly (P<0.05, unpaired two-tailed t-test) from H2/+ are shaded in green. (IK) Adult wing phenotypes produced by targeting RNAi against Notch APG, as indicated, in the posterior of the wing using en-Gal4. (I, J) Wild-type en-Gal4/+ wing; (J) regions used to calculate growth effects in (I) are shown by green shading (posterior territory; L3 was used as the boundary to ensure consistent measurements) and red line (whole wing). (K) Phenotype produced by RNAi targeting CG6191 at 30°C. (L) Effects of RNAi against the indicated genes on wing size. The ratio between the posterior territory (green, J) and the overall wing (red, J) was calculated for control wings (en-Gal4) and for RNAi expressing wings. Graph depicts the difference between RNAi and control ratios from flies grown either at 25°C (grey boxes) or at 30°C (black boxes). Significantly different results (Kolmogorov–Smirnov test) are indicated by coloured squares according to the key, error bars represent standard deviation. RNAi combinations that did not produce viable adults either survived to third instar larvae (L3 discs stain; see Supplementary Figure 3) or were lethal at earlier stages (early lethal).
Figure 4
Figure 4
Notch APG targets exhibit different patterns of response. (A, B) Expression domain of ptc-Gal4 visualized by driving GFP (green in A; E-Cadherin staining in blue), and schematized in (B) (grey); the stripe of expressing cells along the A/P boundary extends from the central wing pouch into the peripheral hinge and pleura. (CN) Differing responses of Notch APG target genes to Nicd could be grouped into four classes, as indicated by the schematics (E, H, K, N) where blue shading approximates the response pattern in relation to the ptc-Gal4 domain (grey). Expression was monitored via LacZ enhancer traps (C, G, I, J, L, M), GFP enhancer trap (F), or by antibody staining (D) in control wild-type wing discs (CM) and in Nicd expressing discs (using ptc-Gal4; yellow arrows, C′M′). (CE) Group 1 response, illustrated by CG6191 (A) and ab (B), consisted of upregulation within ptc-Gal4 domain (yellow arrows C′, D′, blue territory E). Other genes with this response profile are listed with the schematic in (E). (FH) Group 2 response, illustrated by sd (F) and fj (G), consisted of upregulation within the ptc-Gal4 domain (yellow arrows F′, G′), and in adjacent regions (yellow arrowheads F′, G′). Schematized in (H). (IK) Group 3 response, illustrated by CycE (I) and th/DIAP1 (J), consisted of upregulation primarily within peripheral portion of ptc-Gal4 domain (yellow arrows I′, J′) and adjacent territories (yellow arrowheads I′, J′), but with narrow pouch stripe. Other genes with this response profile are listed with the schematic in (K). (LN) Group 4 response, illustrated by fruitless (L) and dm/myc (M), consisted of upregulation only within peripheral portion of ptc-Gal4 domain (yellow arrows L′, M′) and adjacent territories (yellow arrowheads L′, M′). Other genes with this response profile are listed with the schematic in (N).
Figure 5
Figure 5
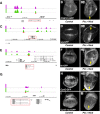
Su(H) bound regions identify Notch responsive enhancers in APG targets. (A, C, E, G) Genomic regions from indicated Notch APG targets showing Su(H) enriched regions (enrichment relative to input, AvgM, scale log2 0–4) in wing discs from Nicd (green) or GFP:Su(H) (purple). Gene models are depicted in black, horizontal numbering indicates genomic coordinates, the upregulated genes are boxed in red, and the DNA fragments tested for their Notch pathway sensitivity in (B, D, F, H, I) are indicated by red rectangle above. (B, D, F, H) Patterns of GFP expression generated by enhancers from the indicated genes in control (B, D, F, H) and Nicd expressing (B′, D′, F′, H′) discs. Fragments depicted in (A, C, E, G) were inserted upstream of minimal promoter fused to GFP and the resulting expression patterns examined in transgenic flies in the absence or presence of ectopic Nicd as indicated. Arrows indicate the stripe of Nicd expression (ptc-Gal4 stripe). All four enhancers are upregulated, recapitulating some or all of the expression from cognate gene (see Figure 4). (I) Mutation of Su(H) binding motifs in CycE enhancer compromises expression. Two conserved Su(H) binding motifs were identified. Site-directed mutagenesis resulted in an enhancer giving no basal expression at the DV boundary (I) and little residual response to ectopic Nicd (I′, yellow arrows).
Figure 6
Figure 6
Cross-regulatory interactions between targets shape the response patterns. (AL) Effects of upd, E(spl)m8, sd RNAi, and vg RNAi, on expression of myc-lacZ (dm-lacZ; AC, GI) and DIAP1/th-lacZ (th-lacZ; DF, JL) in the indicated conditions compared to wild type (A, D). Expression of Upd promotes expression of dm-lacZ (B) and th-lacZ (E) whereas expression of E(spl)m8 inhibits dm-lacZ but not th-lacZ (C, F, yellow arrowheads). Upregulation of dm-lacZ and th-lacZ by Nicd is restricted to the periphery (G, J) but when sd (sd RNAi; H, K) or vg (vg RNAi; I, L) is simultaneously ablated both dm-lacZ and th-lacZ activation occurs more broadly in the pouch (H, K, I, L yellow arrows). (M) Motifs located within the th/DIAP1 NRE indicate the potential for regulatory input in the wing discs. Genomic region from th/DIAP1 showing Su(H) bound region in Nicd overexpressing disc (green) in relation to conserved Su(H) binding motifs (blue), validated solo Sd binding site responsive to the Hippo pathway (orange; Wu et al, 2008), and validated tandem Stat92E sites responsive to the Jak/Stat pathway (purple; Betz et al, 2008). Gene models are depicted in black and horizontal numbering indicates genomic coordinates. (N) Model of regulatory network downstream of ectopic Notch activation (N act) that shapes the proliferative response. Upregulation of diffusible signals (wg and upd) and feed-forward repression (e.g., sd and vg) are proposed to act in combination with Notch at many targets (e.g., dm/myc and th/DIAP1) so that overgrowth occurs predominantly at the periphery (hinge and pleura). This is a simplified model, and we note that some targets (th and cycE) are also expressed at sites of endogenous N activity in the wing pouch (d/v boundary).

References

    1. Anderson JS, Teutsch M, Dong Z, Wortis HH (1996) An essential role for Bruton’s [corrected] tyrosine kinase in the regulation of B-cell apoptosis. Proc Natl Acad Sci USA 93: 10966–10971 - PMC - PubMed
    1. Bach EA, Ekas LA, Ayala-Camargo A, Flaherty MS, Lee H, Perrimon N, Baeg G-H (2007) GFP reporters detect the activation of the Drosophila JAK/STAT pathway in vivo. Gene Expr Patterns 7: 323–331 - PubMed
    1. Bachmann A, Knust E (1998) Dissection of cis-regulatory elements of the Drosophila gene Serrate. Dev Genes Evol 208: 346–351 - PubMed
    1. Baonza A, Garcia-Bellido A (2000) Notch signaling directly controls cell proliferation in the Drosophila wing disc. Proc Natl Acad Sci USA 97: 2609–2614 - PMC - PubMed
    1. Betz A, Ryoo HD, Steller H, Darnell JE Jr (2008) STAT92E is a positive regulator of Drosophila inhibitor of apoptosis 1 (DIAP/1) and protects against radiation-induced apoptosis. Proc Natl Acad Sci USA 105: 13805–13810 - PMC - PubMed

Publication types

MeSH terms

Associated data