. 2013 Mar;23(3):452-61.
doi: 10.1101/gr.147678.112. Epub 2012 Dec 10.

TRIM28 repression of retrotransposon-based enhancers is necessary to preserve transcriptional dynamics in embryonic stem cells

Affiliations

TRIM28 repression of retrotransposon-based enhancers is necessary to preserve transcriptional dynamics in embryonic stem cells

Helen M Rowe et al. Genome Res. 2013 Mar.

Abstract

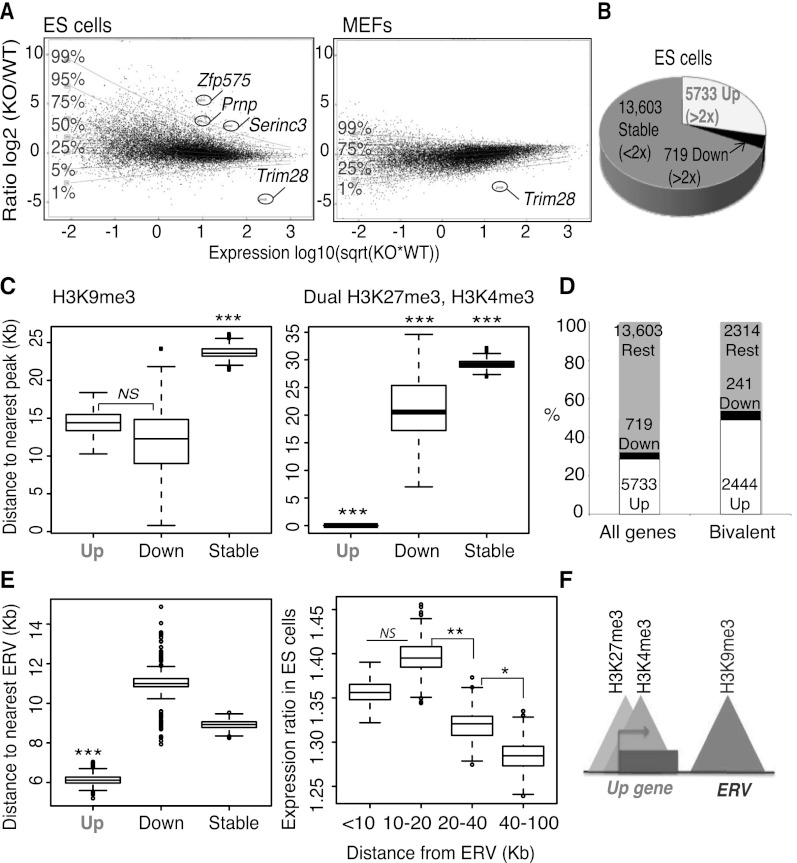
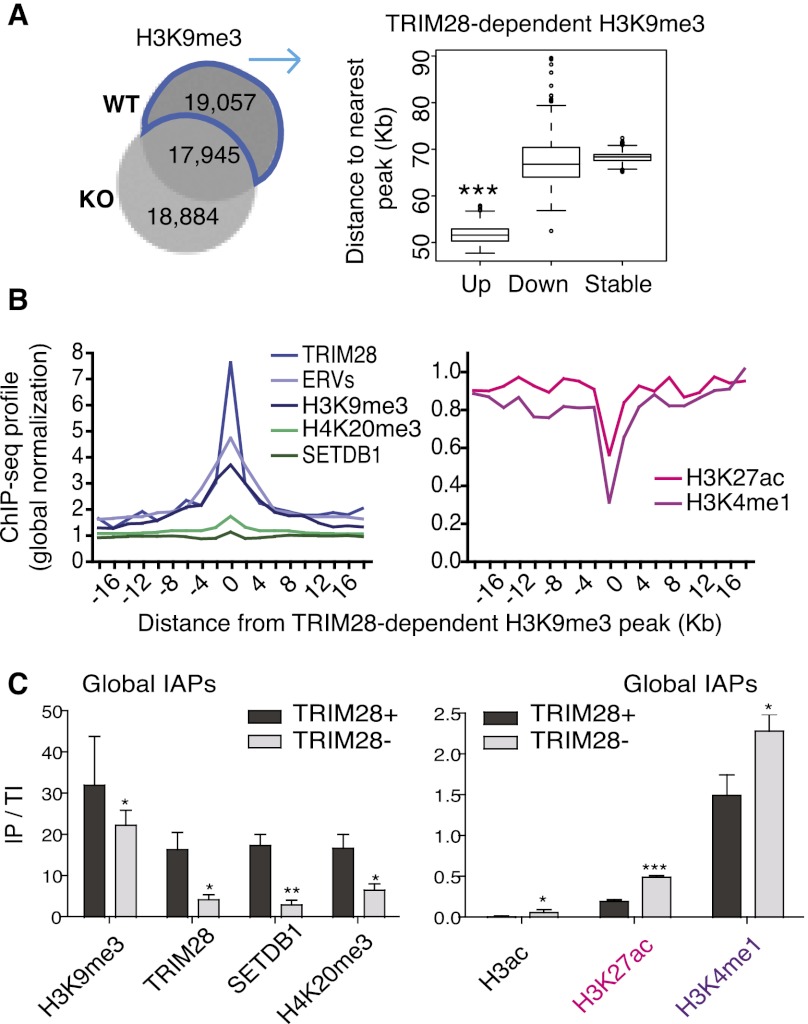
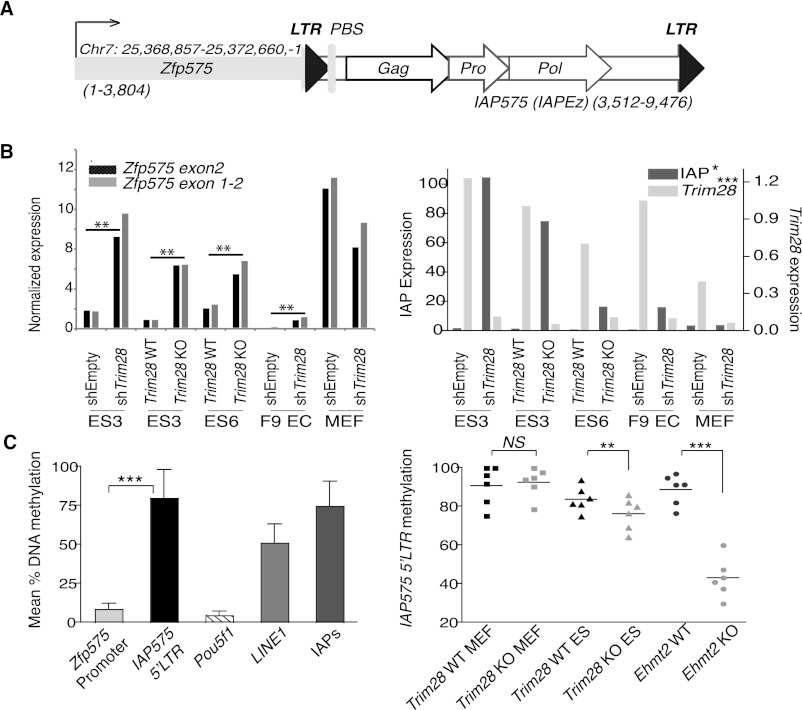
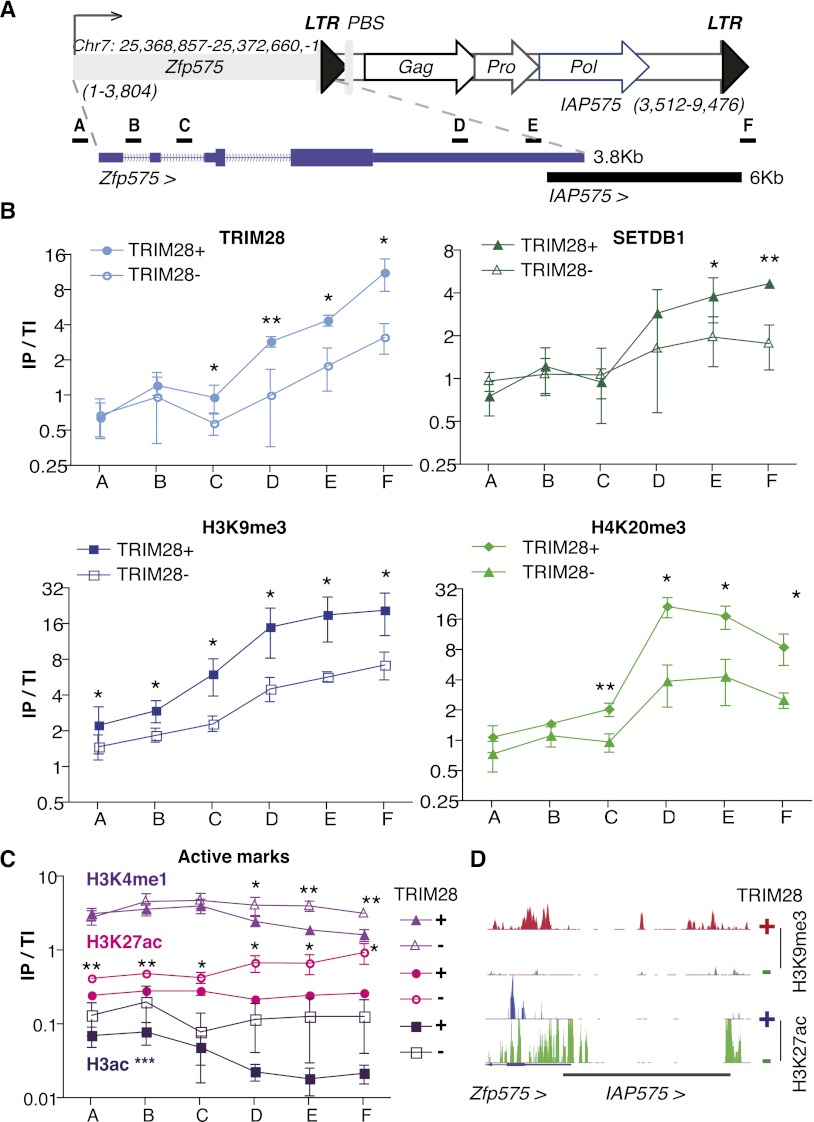
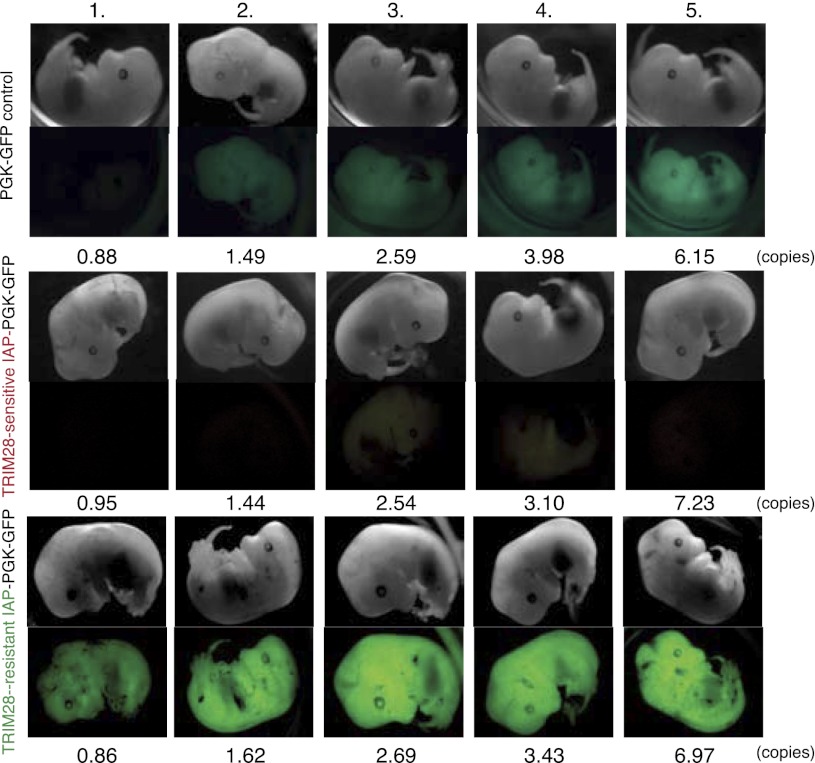
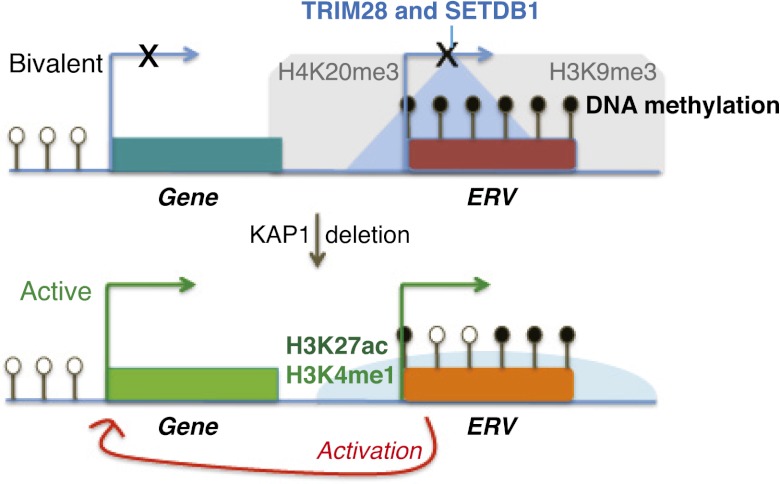
TRIM28 is critical for the silencing of endogenous retroviruses (ERVs) in embryonic stem (ES) cells. Here, we reveal that an essential impact of this process is the protection of cellular gene expression in early embryos from perturbation by cis-acting activators contained within these retroelements. In TRIM28-depleted ES cells, repressive chromatin marks at ERVs are replaced by histone modifications typical of active enhancers, stimulating transcription of nearby cellular genes, notably those harboring bivalent promoters. Correspondingly, ERV-derived sequences can repress or enhance expression from an adjacent promoter in transgenic embryos depending on their TRIM28 sensitivity in ES cells. TRIM28-mediated control of ERVs is therefore crucial not just to prevent retrotransposition, but more broadly to safeguard the transcriptional dynamics of early embryos.


Figures

Figure 1.
Figure 1.
Trim28 deletion in ES cells leads to up-regulation of genes close to ERVs, including many bivalent genes. (A) mRNA-seq in Trim28 wild-type (WT) and knock-out (KO) embryonic stem (ES) cells (left panel) or Trim28 WT and KO MEFs (right panel). Transcripts (assembly mm9) are plotted in black with the ratio on the y-axis and expression level on the x-axis. (Sqrt) Square root. (Horizontal lines) Levels of gene deregulation (e.g., only 1% of genes lie above the 99% line). The genes Zfp575, Prnp, and Serinc3 (referred to later) are highlighted, as well as Trim28. (B) Data from ES cells in A were used to group transcripts depending on whether they were greater than twofold up-regulated (Up), greater than twofold down-regulated (Down), or less than twofold affected (Stable). Up and Down genes were significantly changed based on a DESeq test (Anders and Huber 2010) (adjusted P-values ≤0.05). (C) The distance to the nearest peak (of either H3K9me3 on the left panel, 19,128 peaks, or dual H3K27me3, H3K4me3 peaks on the right panel, 12,390 peaks) from Up, Down, and Stable gene groups. (Left P-values) Up versus Down, not significant (NS), P = 0.48; Up versus Stable, P = 7.7 × 10⁻¹⁰; Down versus Stable, P = 0.0010. (Right P-values) Up versus Down, P = 9.9 × 10⁻¹¹; Up versus Stable, P ≤ 2.2 × 10⁻¹⁶; Down versus Stable, P = 4.1 × 10⁻⁴. (D) Bivalent genes (as defined above by the presence of dual H3K27me3, H3K4me3 peaks) are enriched for up-regulated genes compared with all genes. (E) ERV locations (N = 82,382) were downloaded from the UCSC Genome Browser to include the categories ERV, ERV1, ERVK, and ERVL as defined by Repbase with a size cutoff of 500-bp minimum and used to plot the distance to the nearest ERV from Up, Down, and Stable gene groups (left). A Mann-Whitney Wilcoxon test was used to calculate significance: Up genes were significantly closer than the other two gene groups; (***) P ≤ 0.001. (Right) All genes were divided into groups based on their distance to the nearest ERV and their ratio between Trim28 WT and KO ES cells plotted on the y-axis. (P-values) The groups 10–20 versus 20–40 and 20–40 versus 40–100 are different: P = 0.0048 and P = 0.01, respectively. (F) Model showing that Up genes are close to H3K9me3 marks and ERVs and are often bivalent.
Figure 2.
Figure 2.
Trim28 deletion triggers a switch from repressive to active chromatin marks at ERVs. (A) Venn diagram of H3K9me3 ChIP-seq peaks in WT versus KO ES cells (left). 19,057 peaks are present in WT but lost in KO cells and so are defined as TRIM28-dependent peaks, which cluster closer to Up genes than Down (P = 0.001418) and Stable (P ≤ 2.2 × 10⁻¹⁶) genes (right). (B) TRIM28-dependent H3K9me3 peaks (see above) were assessed for correlation with ChIP-seq data sets. Positive correlations are shown on the left graph and anti-correlations on the right. All data displayed after global normalization of ChIP-seq counts. (C) ChIP results for repressive (left panel) and active (right panel) marks present at global IAPs (using IAP 5′-UTR primers). Bars show the mean and SD of three to four ChIPs per antibody with immunoprecipitate values normalized to total inputs (IP/TI) relative to Gapdh. Negative controls of no antibody were used in all experiments giving no enrichments, while the Pou5f1 enhancer served as a positive control with high enrichments for both H3K27ac and H3K4me1 of 1.1 and 7.5, respectively. Results were also reproduced in an independent ES cell line (Rex1). Paired t-tests were used to compare WT and TRIM28-depleted samples for each antibody: H3K9me3, P = 0.014; TRIM28, P = 0.027; SETDB1, P = 0.0036; H4K20me3, P = 0.0308; H3ac, P = 0.0337; H3K27ac, P ≤ 0.0001; H3K4me1, P = 0.011.
Figure 3.
Figure 3.
Expression and cytosine methylation at the Zfp575 gene and adjacent IAP. (A) Map (drawn to scale) of the Zfp575 gene that just overlaps a full-length IAP (named IAP575 and of the IAPEz type) with both gene and IAP in the same orientation (sizes of each are stated). (LTR) Long terminal repeat; (PBS) primer binding site; (Gag) group-specific antigen; (Pro) protease; (Pol) polymerase. (B) TRIM28 knock-out and knockdown (comparing control, shEmpty and KD, shTRIM28) cell lines were assessed for their expression of Zfp575 (left panel) using two different primer sets, or TRIM28 or IAPs as controls (right panel). Unpaired t-tests were used to compare controls with TRIM28-depleted samples for all ES and EC cell lines: Zfp575, P = 0.0015; IAP, P = 0.0344; TRIM28, P = 0.0008. Since Zfp575 is normally expressed specifically in brain, we also verified it to be expressed in primary neurospheres and brain (data not shown). (C) Quantitative pyrosequencing was used to measure DNA methylation levels at the Zfp575 promoter versus the flanking 5′-LTR IAP575 promoter (left panel). Control primers were specific for the Pou5f1 promoter or global LINE1s or global IAP LTRs (IAPs). Bars represent means over multiple CpG positions with error bars showing the SD across all CpGs. (Right panel) Samples were compared (across six CpG positions) for their methylation levels at the IAP575 promoter. Primordial germ cells were also used to show that IAP575 is demethylated in germ cells to a level not much lower than in Trim28-deleted ES cells (e.g., to an average of 69% instead of 76%) (data not shown). Two-tailed paired t-tests display all significant differences: Trim28 WT versus KO ES, P = 0.0088; Ehmt2 WT versus KO, P = 0.0001.
Figure 4.
Figure 4.
Zfp575 is regulated by a gain of active chromatin marks at its adjacent IAP575. (A) Map of Zfp575 and its adjacent IAP575 (for details, see Fig. 3A) with an enlargement shown underneath to show where primer pairs for ChIP are located. (B) ChIP results of repressive marks. (IP/TI) Immunoprecipitate values were normalized to their respective total inputs and to Gapdh. Bars represent the mean and SD of three to four ChIPs per antibody, and experiments were also reproduced in another ES cell line (Rex1) (data not shown). In each experiment, controls of no antibody were included giving no enrichments. Differences between WT and TRIM28-depleted samples were assessed for each primer set using paired t-tests with all significant differences given; (*) P ≤ 0.05, (**) P ≤ 0.01. (C) ChIPs this time on active marks were performed as described in B with data representing three to four ChIPs per antibody. Additionally, here the Pou5f1 enhancer was used as a positive control (data not shown) showing high enrichment for both H3K4me1 and H3K27ac but not for TRIM28 or H3K9me3. For H3K4me1 and H3K27ac, all significant differences are shown for each primer set, while for H3ac, WT samples were significantly different from TRIM28-depleted ones, not for individual points but over all primer sets; (***) P ≤ 0.001. (D) ChIP-seq maps of H3K9me3 and H3K27ac in TRIM28 WT and depleted ES cells (set to the same vertical scale) at the Zfp575-IAP575 locus. Note that reads within ERVs, especially conserved ones (in black), are usually missing due to the inability to map reads within highly repeated sequences. However, reads are present at the borders of these elements.
Figure 5.
Figure 5.
ERV sequences that escape TRIM28-mediated repression can act as activators during embryogenesis. Lentiviral transgenesis was performed with an empty PGK-GFP vector (PGK-GFP control, upper panels), or with the same vector including either an IAP4 (TRIM28-sensitive IAP-PGK-GFP, middle panels) or an IAP1 (TRIM28-resistant IAP-PGK-GFP, lower panels) sequence cloned antisense upstream of the PGK promoter. At E13, embryos were scored for GFP expression and vector copy numbers. For the PGK-GFP control, 13/29 embryos were green. For the TRIM28-sensitive IAP-PGK-GFP, 4/19 embryos were green (all with copy numbers above 16), and 4/19 pale green (including numbers 3 and 4 in this figure). For the TRIM28-resistant IAP-PGK-GFP, 12/17 embryos were green (including one with a copy number above 10), and 2/17 pale green (with copy numbers of 0.95 and 0.89). Embryos with similar copy numbers per vector group are shown in each column with increasing copy numbers by row. Vectors were injected twice with similar results. In one experiment, MEFs were derived from embryos to verify that microscopy differences were reproduced by flow cytometry (data not shown).
Figure 6.
Figure 6.
Summary model: Substitution of TRIM28-dependent repressive chromatin by the active marks H3K4me1 and H3K27ac at specific ERV-Up gene pairs parallels activation of gene expression.

References

    1. Anders S, Huber W 2010. Differential expression analysis for sequence count data. Genome Biol 11: R106. - PMC - PubMed
    1. Barde I, Salmon P, Trono D 2010. Production and titration of lentiviral vectors. Curr Protoc Neurosci 53: 4.21.1–4.21.23 - PubMed
    1. Bernstein BE, Mikkelsen TS, Xie X, Kamal M, Huebert DJ, Cuff J, Fry B, Meissner A, Wernig M, Plath K, et al. 2006. A bivalent chromatin structure marks key developmental genes in embryonic stem cells. Cell 125: 315–326 - PubMed
    1. Bilodeau S, Kagey MH, Frampton GM, Rahl PB, Young RA 2009. SetDB1 contributes to repression of genes encoding developmental regulators and maintenance of ES cell state. Genes Dev 23: 2484–2489 - PMC - PubMed
    1. Bojkowska K, Aloisio F, Cassano M, Kapopoulou A, de Sio FS, Zangger N, Offner S, Cartoni C, Thomas C, Quenneville S, et al. 2012. Liver-specific ablation of KRAB associated protein 1 in mice leads to male-predominant hepatosteatosis and development of liver adenoma. Hepatology 56: 1279–1290 - PMC - PubMed

Publication types

MeSH terms