. 2013 Feb 1;73(3):1232-44.
doi: 10.1158/0008-5472.CAN-12-2968. Epub 2012 Dec 11.

Epigenetic repression of miR-31 disrupts androgen receptor homeostasis and contributes to prostate cancer progression

Affiliations

Epigenetic repression of miR-31 disrupts androgen receptor homeostasis and contributes to prostate cancer progression

Pei-Chun Lin et al. Cancer Res. .

Abstract

Androgen receptor signaling plays a critical role in prostate cancer pathogenesis. Yet, the regulation of androgen receptor signaling remains elusive. Even with stringent androgen deprivation therapy, androgen receptor signaling persists. Here, our data suggest that there is a complex interaction between the expression of the tumor suppressor miRNA, miR-31, and androgen receptor signaling. We examined primary and metastatic prostate cancer and found that miR-31 expression was reduced as a result of promoter hypermethylation, and importantly, the levels of miR-31 expression were inversely correlated with the aggressiveness of the disease. As the expression of androgen receptor and miR-31 was inversely correlated in the cell lines, our study further suggested that miR-31 and androgen receptor could mutually repress each other. Upregulation of miR-31 effectively suppressed androgen receptor expression through multiple mechanisms and inhibited prostate cancer growth in vivo. Notably, we found that miR-31 targeted androgen receptor directly at a site located in the coding region, which was commonly mutated in prostate cancer. In addition, miR-31 suppressed cell-cycle regulators including E2F1, E2F2, EXO1, FOXM1, and MCM2. Together, our findings suggest a novel androgen receptor regulatory mechanism mediated through miR-31 expression. The downregulation of miR-31 may disrupt cellular homeostasis and contribute to the evolution and progression of prostate cancer. We provide implications for epigenetic treatment and support clinical development of detecting miR-31 promoter methylation as a novel biomarker.


Conflict of interest statement

Disclosure of Potential Conflicts of Interest

No potential conflicts of interest were disclosed.

Figures
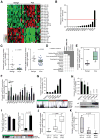
Figure 1
Figure 1
MiR-31 is downregulated in PCA due to promoter hypermethylation. A, heatmap of the 25 differentially expressed miRNAs in PCA as compared to matched benign tissues (Benign), red = high expression, green = low expression. B, expression ratio of miR-31 in PCA to matched Benign, red line for ratio 1. C, expression of miR-31 and MIR31HG in 40 PCA and 15 Benign as evaluated by qPCR. D, deletion analysis of chromosome region 9p21.3 in various cancer types, gray indicates genes that fall within the deletion peak. E, DNA methylation levels at the miR-31 promoter in PCA (n=12) and Benign (n=12). F, comparison of overall DNA methylation at the miR-31 promoter in 12 matched pairs (* p < 0.05, ** p < 0.01, *** p < 0.0001). G, DNA methylation at the miR-31 promoter in indicated cell lines. Top: comparison of overall DNA methylation levels; bottom: heatmap of DNA methylation levels. Each row corresponds to an individual sample, and each column corresponds to an individual CpG unit, which is a single CpG site or a combination of CpG sites. H, expression of miR-31 and AR in indicated cell lines by qPCR and immunoblot (n=3). I, VCaP cells treated by vehicle (DMSO) or 5-aza-dC. Left panel and heatmap: DNA methylation levels, right panel: miR-31 levels (n=3). J–K, comparisons of DNA methylation levels at the miR-31 promoter and miR-31 levels between three groups: Gleason score (GS) 6, ≥ 7, and metastatic cancer (METs). All bar graphs are shown with mean ± SEM.
Figure 2
Figure 2
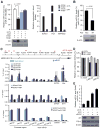
AR and PRC2-mediated repressive histone modification in regulation of miR-31 expression. A, expression of miR-31 (left panel) and NDRG1, PSA, and TMPRSS2 (right panel) in LNCaP cells transfected with AR siRNA (siAR) or control siRNA (siCTL), and treated with 1 nM R1881 or vehicle (ethanol), evaluated by qPCR, and AR expression by immunoblot (n = 3). B, expression of miR-31 and AR in PC3neo cells versus the AR-expressing PC3AR cells, evaluated by qPCR and immunoblot (n = 3). C, quantitative ChIP analysis with AR, EZH2, and H3K27me3 antibodies at the mIR-31 promoter and regions near miR-31 in LNCaP cells treated with 1 nM R1881 or vehicle (ethanol) (n = 3). Red bars represent qPCR regions. D, luciferase activity of reporter constructs containing the miR-31 promoter region of −1,000 bp and downstream region +500bp co-transfected with constructs containing empty vector or AR-CDS with siCTL or siAR in HEK293 cells (n = 3, *p < 0.01). E, LNCaP cells in regular medium, miR-31 levels in response to knockdown of AR, EZH2, or both, evaluated by qPCR, and AR expression by immunoblot (n = 3). All bar graphs are shown with mean ± SEM.
Figure 3
Figure 3
Downregulation of AR by miR-31. A, AR protein level was examined by immunoblot. LNCaP and VCaP cells were transfected with miR-31 or miR-NC (n=3). B, expression of PSA and TMPRSS2 evaluated by qPCR (n = 3). LNCaP cells transfected with siCTL, siAR, miR-NC, miR-31, and miR-31 with AR-CDS for 48 hours, followed by treatment with 1nM R1881 or vehicle (ethanol) for 24 hours. C, schematic graph illustrating predicted locations of three miR-31 MREs within the transcript of AR variant 1. Numbers in parenthesis correspond to the position in the whole transcript (NM_000044). Perfect matches are shown by a line; G:U pairs by a colon (:). D, previously reported mutations are shown in red and the original sequence in bold. Three point mutations, A > G, G > A, and G > T were located within MRE2 and one deletion, ΔG, was located within MRE3. E, luciferase activity of LNCaP cells co-transfected with reporter constructs containing WT, mutant (mt), or empty vector (v) and either miR-31 or miR-NC (n = 3). F, AR expression levels in HEK293 cells co-transfected with AR-CDS WT or mutant containing the G > T mutation in MRE2 and either miR-31 or miR-NC, evaluated by qPCR (n = 3). G, AR expression in PC3AR cells transfected with miR-31, miR-NC, inhibitor negative control (IN-NC), or miR-31 inhibitor (IH-miR-31), evaluated by qPCR and immunoblot (n = 3). **p < 0.01, all bar graphs are shown with mean ± SEM.
Figure 4
Figure 4
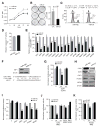
Genes in cell cycle regulation are direct targets of miR-31. A, proliferation assay of LNCaP cells transfected with miR-31 or miR-NC (n = 6, * p < 0.001). B, colony formation analysis of VCaP cells overexpressing miR-31 or vector alone (n = 3). C, cell cycle analysis of LNCaP cells transfected with miR-31 or miR-NC by FACS (n = 3). D, caspase 3/7 activity in LNCaP cells transfected with miR-31 or miR-NC (n = 6). E, expression of genes involved in cell cycle in LNCaP cells transfected with miR-31 or miR-NC, evaluated by qPCR (n = 3). F, immunoblot of E2F1 with lysates from LNCaP cells transfected with miR-31 or miR-NC (top). Schematic graph illustrates the miR-31 MRE within the 3′UTR of E2F1 (bottom). G, luciferase activity of LNCaP cells co-transfected with reporter constructs containing WT or mutant (mt) E2F1 3′UTR or vector alone (v) with either miR-31 or miR-NC (n = 3, **p < 0.01). H, expression levels of indicated proteins from LNCaP cells transfected with miR-31 or miR-NC by immunoblot. I, luciferase activity of LNCaP cells transfected with reporter constructs containing 3′UTRs of CDK1, E2F2, EXO1, FOXM1, or MCM2 in conjunction with miR-31 or miR-NC (n = 3, *p < 0.05, **p < 0.01). J–K, luciferase activity of LNCaP cells transfected with reporter constructs containing WT or mutant MREs of E2F2 and FOXM1 in conjunction with miR-31 or miR-NC (n = 3, *p < 0.05, **p < 0.01). All bar graphs are shown with mean ± SEM.
Figure 5
Figure 5
MiR-31 represses PCA growth in vivo. A–B, luciferase imaging in mice with LNCaP xenografts treated with miR-31 or miR-NC intratumorally. The experiment was terminated after 43 days of initial treatment. C, tumors were removed on Day 43 and weighed. D, representative immunohistochemistry images of AR (top) and Hematoxylin and eosin staining (H&E) (bottom) in LNCaP xenografts treated with miR-31 or miR-NC. Scale bar: 100 μm. E, expression of AR protein levels in LNCaP xenografts treated with miR-31 or miR-NC, evaluated by immunoblot.
Figure 6
Figure 6
Mutual regulatory model of miR-31 and AR. MiR-31 inhibits the expression of AR and several proteins involved in cell cycle regulation and proliferation. On the other hand, AR and H3K27 trimethylation can repress miR-31 expression. During PCA pathogenesis, increased promoter methylation leads to the loss of miR-31 expression. Downregulation of miR-31 in PCA may occur as an early event in PCA resulting in increased AR expression. Alternatively, increased AR expression or activity may be a preliminary event that leads to miR-31 silencing.

References

    1. Siegel R, Naishadham D, Jemal A. Cancer statistics, 2012. CA Cancer J Clin. 2012;62:10–29. - PubMed
    1. Messing EM, Manola J, Sarosdy M, Wilding G, Crawford ED, Trump D. Immediate hormonal therapy compared with observation after radical prostatectomy and pelvic lymphadenectomy in men with node-positive prostate cancer. N Engl J Med. 1999;341:1781–8. - PubMed
    1. Huggins C, Stevens RE, Hodges CV. The effect of castration on advanced carcinoma of the prostate gland. Arch Surg. 1941;43:209–15.
    1. Beltran H, Yelensky R, Frampton GM, Park K, Downing SR, Macdonald TY, et al. Targeted Next-generation Sequencing of Advanced Prostate Cancer Identifies Potential Therapeutic Targets and Disease Heterogeneity. Eur Urol. 2012 Sep 5; doi: 10.1016/j.eururo.2012.08.053.. - DOI - PMC - PubMed
    1. Chen CD, Welsbie DS, Tran C, Baek SH, Chen R, Vessella R, et al. Molecular determinants of resistance to antiandrogen therapy. Nat Med. 2004;10:33–9. - PubMed

Publication types

MeSH terms