

Effects of inspiratory muscle training on dynamic hyperinflation in patients with COPD
- PMID: 23233798
- PMCID: PMC3516469
- DOI: 10.2147/COPD.S23784
Effects of inspiratory muscle training on dynamic hyperinflation in patients with COPD
Abstract
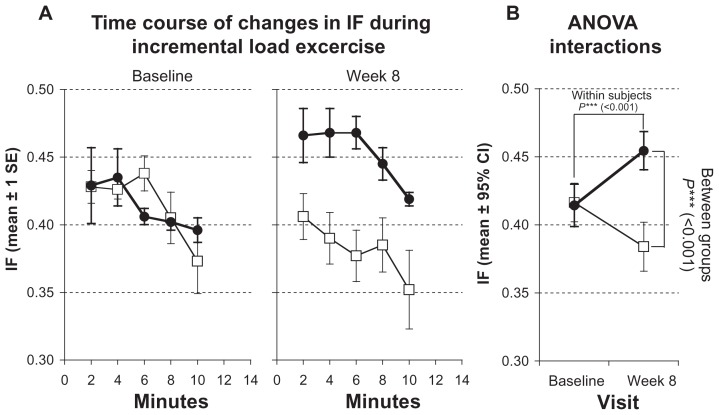
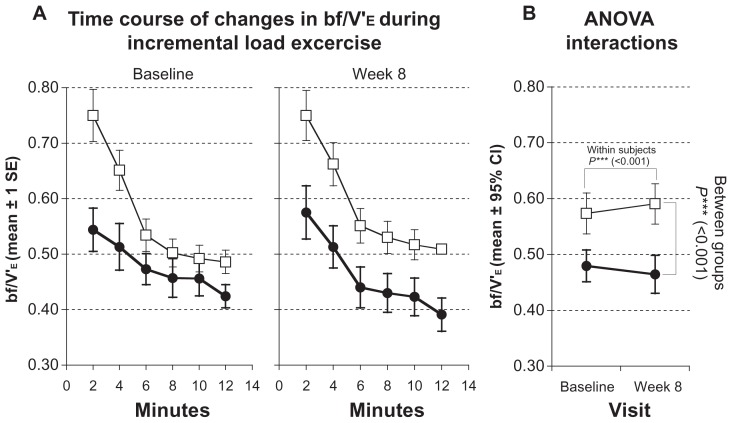
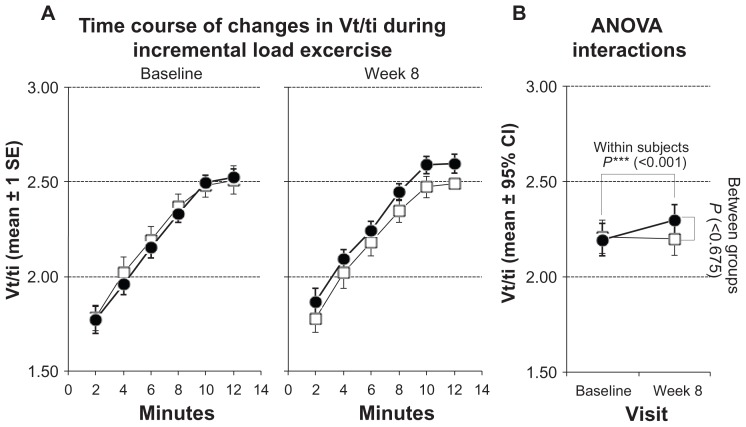
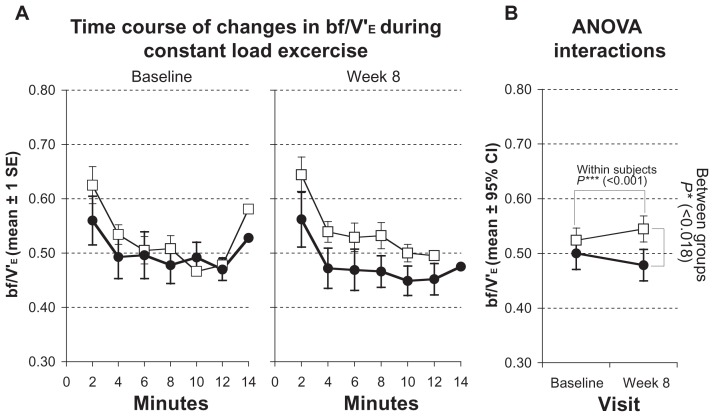
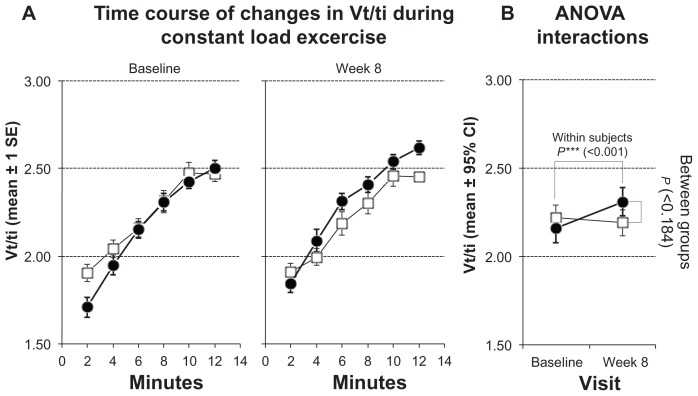
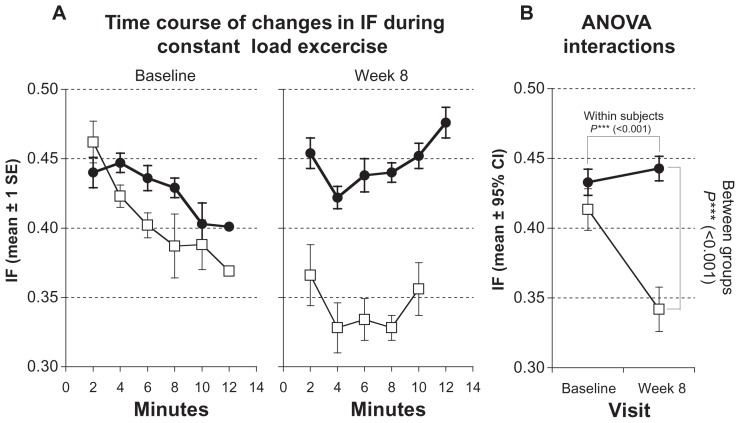
Dynamic hyperinflation has important clinical consequences in patients with chronic obstructive pulmonary disease (COPD). Given that most of these patients have respiratory and peripheral muscle weakness, dyspnea and functional exercise capacity may improve as a result of inspiratory muscle training (IMT). The aim of the study was to analyze the effects of IMT on exercise capacity, dyspnea, and inspiratory fraction (IF) during exercise in patients with COPD. Daily inspiratory muscle strength and endurance training was performed for 8 weeks in 10 patients with COPD GOLD II and III. Ten patients with COPD II and III served as a control group. Maximal inspiratory pressure (Pimax) and endurance time during resistive breathing maneuvers (tlim) served as parameter for inspiratory muscle capacity. Before and after training, the patients performed an incremental symptom limited exercise test to maximum and a constant load test on a cycle ergometer at 75% of the peak work rate obtained in the pretraining incremental test. ET was defined as the duration of loaded pedaling. Following IMT, there was a statistically significant increase in inspiratory muscle performance of the Pimax from 7.75 ± 0.47 to 9.15 ± 0.73 kPa (P < 0.01) and of tlim from 348 ± 54 to 467 ± 58 seconds (P < 0.01). A significant increase in IF, indicating decreased dynamic hyperinflation, was observed during both exercise tests. Further, the ratio of breathing frequency to minute ventilation (bf/V'(E)) decreased significantly, indicating an improved breathing pattern. A significant decrease in perception of dyspnea was also measured. Peak work rate during the incremental cycle ergometer test remained constant, while ET during the constant load test increased significantly from 597.1 ± 80.8 seconds at baseline to 733.6 ± 74.3 seconds (P < 0.01). No significant changes during either exercise tests were measured in the control group. The present study found that in patients with COPD, IMT results in improvement in performance, exercise capacity, sensation of dyspnea, and improvement in the IF prognostic factor.
Trial registration: ClinicalTrials.gov NCT00469313.
Keywords: chronic obstructive pulmonary disease; cycle ergometer test; dynamic hyperinflation; dyspnea; inspiratory muscle training.
Figures
References
-
- O’Donnell DE, Bertley JC, Chau LK, Webb KA. Qualitative aspects of exertional breathlessness in chronic airflow limitation: pathophysiologic mechanisms. Am J Respir Crit Care Med. 1997;155(1):109–115. - PubMed
-
- Nici L, Donner C, Wouters E, et al. ATS/ERS Pulmonary Rehabilitation Writing Committee. American Thoracic Society/European Respiratory Society statement on pulmonary rehabilitation. Am J Respir Crit Care Med. 2006;173(12):1390–1413. - PubMed
-
- Wanke T, Formanek D, Lahrmann H, et al. Effects of combined inspiratory muscle and cycle ergometer training on exercise performance in patients with COPD. Eur Respir J. 1994;7(12):2205–2211. - PubMed
-
- Standardization of Spirometry, 1994 Update. American Thoracic Society. Am J Respir Crit Care Med. 1995;152(3):1107–1136. [No authors listed] - PubMed
-
- ATS ACCP statement on cardiopulmonary exercise testing. Am J Res Crit Care Med. 2003;166:111–116.
Publication types
MeSH terms
Associated data
LinkOut - more resources
Full Text Sources
Medical
Miscellaneous
