. 2012 Dec 12:10:162.
doi: 10.1186/1741-7015-10-162.

The age distribution of mortality due to influenza: pandemic and peri-pandemic

Affiliations

The age distribution of mortality due to influenza: pandemic and peri-pandemic

Tom Reichert et al. BMC Med. .

Abstract

Background: Pandemic influenza is said to 'shift mortality' to younger age groups; but also to spare a subpopulation of the elderly population. Does one of these effects dominate? Might this have important ramifications?

Methods: We estimated age-specific excess mortality rates for all-years for which data were available in the 20th century for Australia, Canada, France, Japan, the UK, and the USA for people older than 44 years of age. We modeled variation with age, and standardized estimates to allow direct comparison across age groups and countries. Attack rate data for four pandemics were assembled.

Results: For nearly all seasons, an exponential model characterized mortality data extremely well. For seasons of emergence and a variable number of seasons following, however, a subpopulation above a threshold age invariably enjoyed reduced mortality. 'Immune escape', a stepwise increase in mortality among the oldest elderly, was observed a number of seasons after both the A(H2N2) and A(H3N2) pandemics. The number of seasons from emergence to escape varied by country. For the latter pandemic, mortality rates in four countries increased for younger age groups but only in the season following that of emergence. Adaptation to both emergent viruses was apparent as a progressive decrease in mortality rates, which, with two exceptions, was seen only in younger age groups. Pandemic attack rate variation with age was estimated to be similar across four pandemics with very different mortality impact.

Conclusions: In all influenza pandemics of the 20th century, emergent viruses resembled those that had circulated previously within the lifespan of then-living people. Such individuals were relatively immune to the emergent strain, but this immunity waned with mutation of the emergent virus. An immune subpopulation complicates and may invalidate vaccine trials. Pandemic influenza does not 'shift' mortality to younger age groups; rather, the mortality level is reset by the virulence of the emerging virus and is moderated by immunity of past experience. In this study, we found that after immune escape, older age groups showed no further mortality reduction, despite their being the principal target of conventional influenza vaccines. Vaccines incorporating variants of pandemic viruses seem to provide little benefit to those previously immune. If attack rates truly are similar across pandemics, it must be the case that immunity to the pandemic virus does not prevent infection, but only mitigates the consequences.


Figures
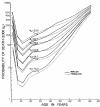
Figure 1
Figure 1
The probability of death versus age for human populations of successively longer median life expectancy (expressed as deaths per 1000 population). Source: Department of Social Affairs. Population Branch, Age and Sex Patterns of Mortality: Model Life Tables for Underdeveloped Countries. Population Studies, No. 22, New York, United Nations, 1955.
Figure 2
Figure 2
The evolution of observed age-specific all-cause mortality rates, scaled per 1000 population, in Canada over the second half of the 20th century. This evolution dovetails with the historical model of socioeconomic evolution.
Figure 3
Figure 3
A semi-log plot of excess all-cause mortality variation with age for epidemic seasons during the era of circulation of influenza A(H2N2) viruses in Canada. The 1960/61 and 1964/5 seasons were dominated by B-type viruses, and the 1962/3 and 1967/8 seasons were dominated in mortality by H2N2 viruses.
Figure 4
Figure 4
A semi-log plot of excess All-Cause excess mortality rate variation with age for epidemic seasons during the era of circulation of influenza A(H2N2) viruses in Canada (A) and Japan (B). The pandemic season appears as a dashed red line. Old elderly had their lowest mortality in that season. The most recent precedent season dominated by H1 viruses appears in purple. Mortality was generally decreased in the pandemic in Japan. The different time courses of immune escape in these countries are shown in Canada (C) and Japan (D)
Figure 5
Figure 5
A semi-log plot of excess all-cause mortality rate variation with age for epidemic seasons before, including and immediately after the emergence of A(H3N2) viruses in (A) Australia, (B) Canada, (C) France, (D) Japan, the (E)UK and the (F) US, in alphabetical order. The pandemic season is shown as a dashed dark-green line. For countries other than the USA and Canada, the season of emergence was one of low mortality, while the second season was severe (short-dashed fuchsia line). The oldest elderly population over the age of 78 years had reduced mortality in the severe pandemic season, everywhere. This mortality reduction was lost abruptly in the 1975/6 season, except in France.
Figure 6
Figure 6
Area plots of centered and scaled excess all-cause mortality for all age groups for all data available for the second half of the 20th century. Data are for (A) Australia, (B) Canada, (C) France, (D) Japan, (E) the UK, and (F) the US. Values for the oldest age group are outlined by a black dashed line and filled in purple. Color breakthroughs demarcate seasons of immunoprotection of the old elderly sub-population.
Figure 7
Figure 7
A semi-log plot of excess all-cause mortality rate variation with age for H3-dominated seasons of immune escape and later. Six countries ((A) Australia, (B) Canada, (C) France, (D) Japan, (E) the UK, and (F) the USA) are shown, in alphabetical order.
Figure 8
Figure 8
An estimate of age-specific attack rates hypothetically applicable to all pandemic seasons. The data displayed are for the pandemics of 1918/9, 1957/8, 1968/9. and 2009/10. The data for 1968/9 come from two studies. The data from Davis et al. were fit separately. All other data are fit well by a linear trend that decreased linearly with age.

References

    1. Thompson WW, Shay DK, Weintraub E, Brammer L, Cox N, Anderson LJ, Fukuda K. Mortality associated with influenza and respiratory syncytial virus in the United States. JAMA. 2003;289:179–186. doi: 10.1001/jama.289.2.179. - DOI - PubMed
    1. Simonsen L, Reichert TA, Viboud C, Blackwelder WC, Taylor RJ, Miller MA. Impact of influenza vaccination on seasonal mortality in the US elderly population. Arch Int Med. 2005;165:265–72. - PubMed
    1. Scholtissek C. In: Textbook of Influenza. Nicholson KG, Webster RG, Hay AJ, editor. Oxford: Blackwell Science; 1998. Genetic reassortment of human influenza viruses in nature. Chap 11.
    1. Smith GJD, Bahl J, Vijaykrishna D, Zhang J, Poon LLM, Chen H, Webster RG, Peiris JSM, Guan Y. Dating the emergence of pandemic influenza viruses. PNAS. 2009;106:11709–12. doi: 10.1073/pnas.0904991106. - DOI - PMC - PubMed
    1. McCullers JA, Saito T, Iverson AR. Multiple genotypes of influenza B virus circulated between 1979 and 2003. J Virol. 2004;78:12817–28. doi: 10.1128/JVI.78.23.12817-12828.2004. - DOI - PMC - PubMed

Publication types