. 2013 May;83(5):845-54.
doi: 10.1038/ki.2012.393. Epub 2012 Dec 12.

The synthetic triterpenoid, RTA 405, increases the glomerular filtration rate and reduces angiotensin II-induced contraction of glomerular mesangial cells

Affiliations

The synthetic triterpenoid, RTA 405, increases the glomerular filtration rate and reduces angiotensin II-induced contraction of glomerular mesangial cells

Yanfeng Ding et al. Kidney Int. 2013 May.

Abstract

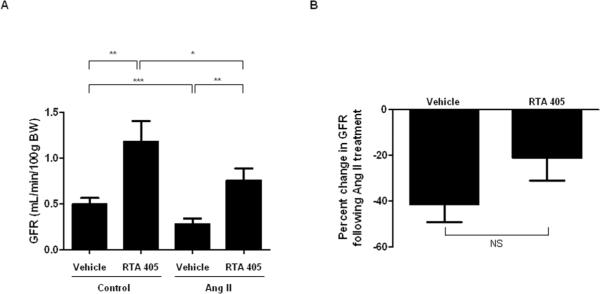
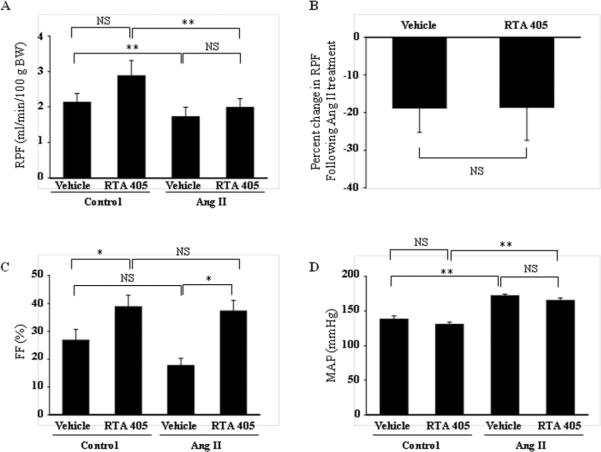
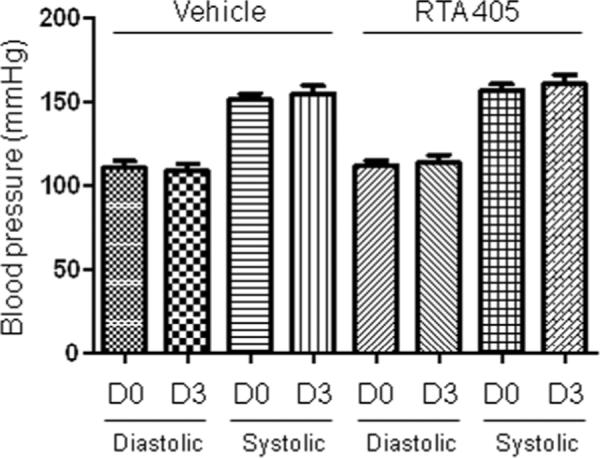
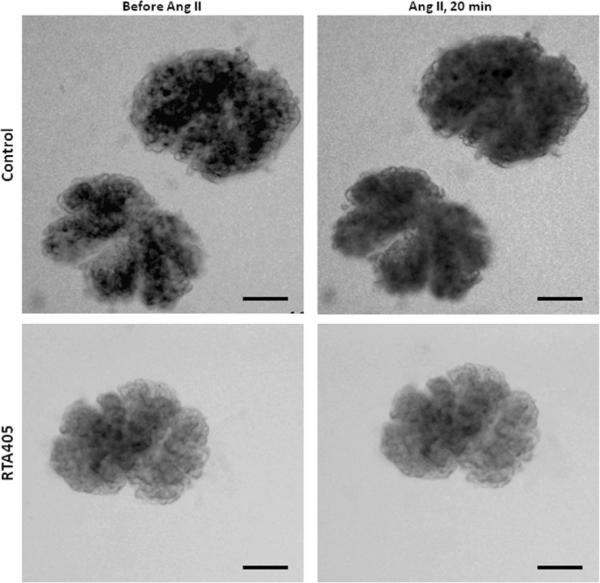
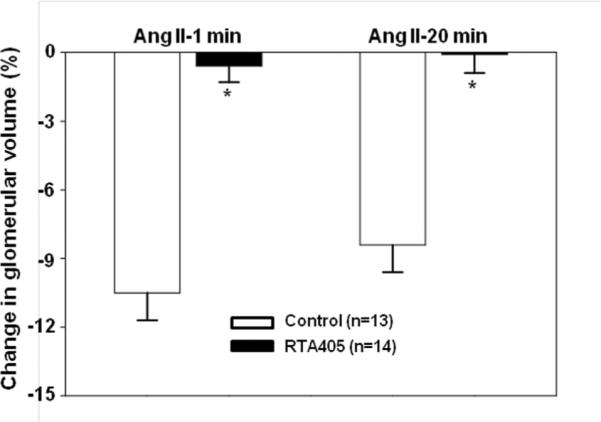
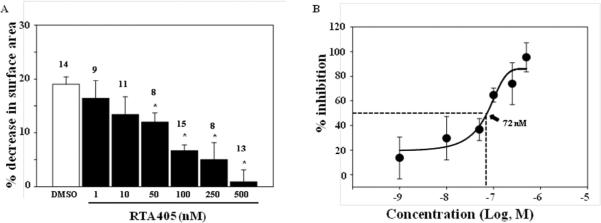
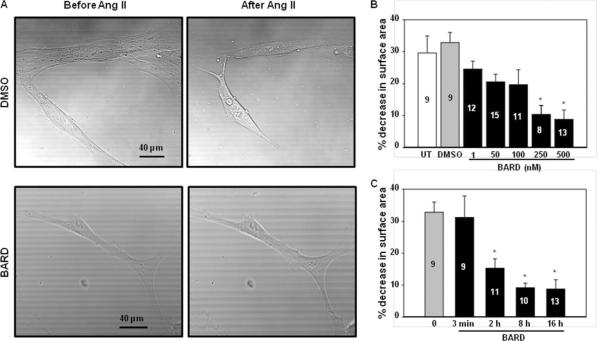
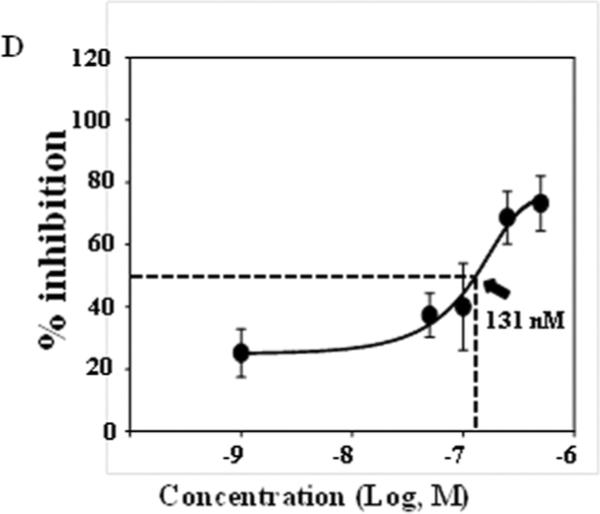
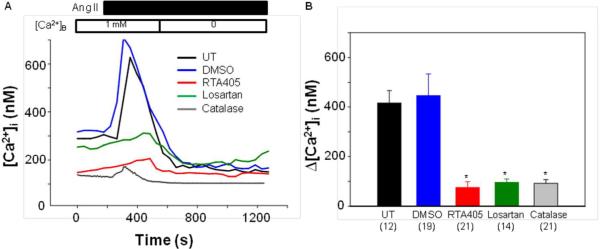
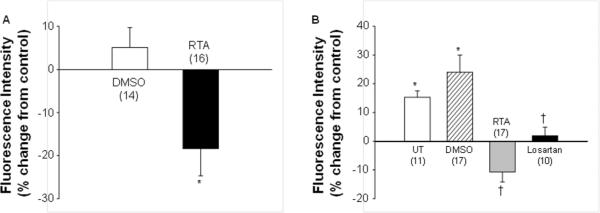
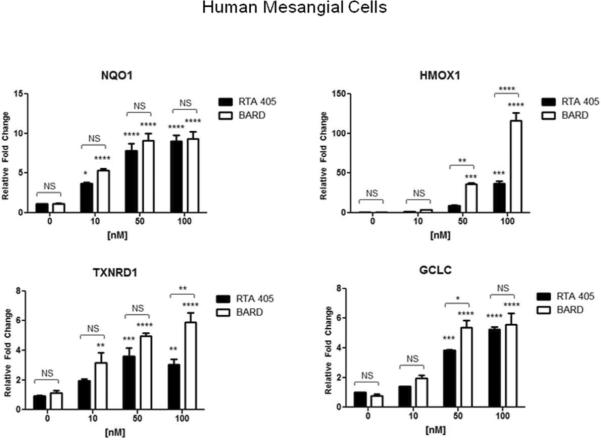
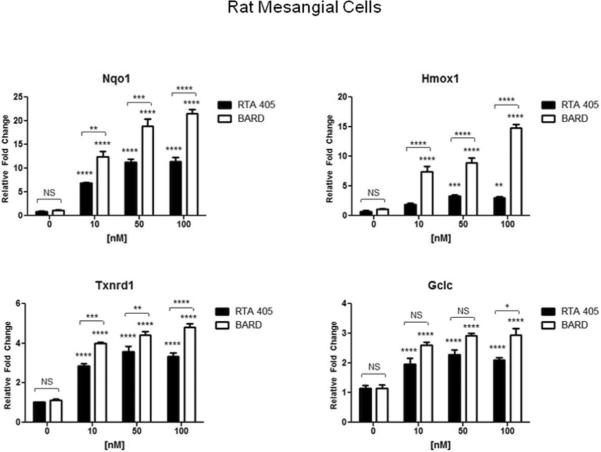
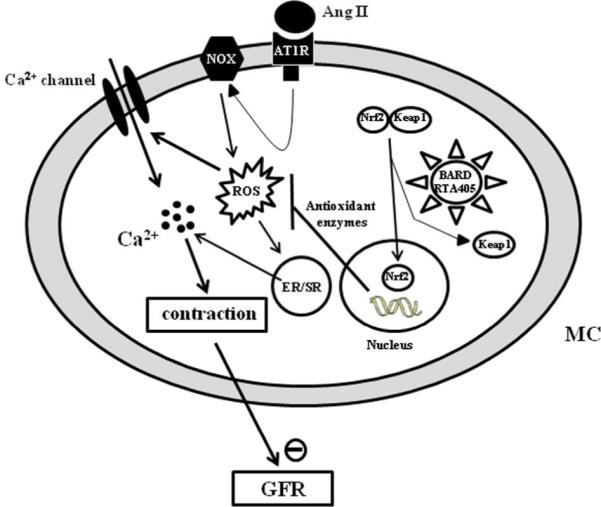
Bardoxolone methyl, a synthetic triterpenoid, improves the estimated glomerular filtration rate (GFR) in patients with chronic kidney disease and type 2 diabetes. Since the contractile activity of mesangial cells may influence glomerular filtration, we evaluated the effect of the synthetic triterpenoid RTA 405, with structural similarity to bardoxolone methyl, on GFR in rats and on mesangial cell contractility in freshly isolated glomeruli. In rats, RTA 405 increased basal GFR, assessed by inulin clearance, and attenuated the angiotensin II-induced decline in GFR. RTA 405 increased the filtration fraction, but did not affect arterial blood pressure or renal plasma flow. Glomeruli from RTA 405-treated rats were resistant to angiotensin II-induced volume reduction ex vivo. In cultured mesangial cells, angiotensin II-stimulated contraction was attenuated by RTA 405, in a dose- and time-dependent fashion. Further, Nrf2-targeted gene transcription (regulates antioxidant, anti-inflammatory, and cytoprotective responses) in mesangial cells was associated with decreased basal and reduced angiotensin II-stimulated hydrogen peroxide and calcium ion levels. These mechanisms contribute to the GFR increase that occurs following treatment with RTA 405 in rats and may underlie the effect of bardoxolone methyl on the estimated GFR in patients.


Figures

Fig. 1
Fig. 1. Effect of RTA 405 on basal GFR and Ang II-induced changes in GFR in rats
Rats were treated with RTA 405 at 100 mg/kg body weight (N=16) or the same volume of vehicle (sesame oil; N=15) by oral gavage once daily for 3 consecutive days. GFR was measured 12–16 hours after the last dose of RTA 405 was received. A: Effect of vehicle or RTA 405 on GFR in rats before and after treatment with Ang II. B: Percent change in GFR following treatment with Ang II. NS, not significant;.* P<0.05; ** P<0.01; *** P<0.001
Fig. 2
Fig. 2. Effect of RTA 405 on basal and Ang II-induced changes in RPF (A and B), basal FF (C) and blood pressure (D) in rats
Rats were treated with RTA 405 at 100 mg/kg body weight (N=24) or the same volume of sesame oil (N=23) by oral gavage once daily for 3 consecutive days. Measurements were conducted 12–16 hours after the last dose of RTA 405 was received. In D, mean arterial blood pressure was measured before (Control) and 30 min after infusion of Ang II in both groups of rats. The numbers of rats in each group (Vehicle vs. RTA 405) were: for RPF, 18 vs. 17; for FF, 16 vs. 15, and for mean arterial blood pressure, 6 vs. 6. NS, not significant; * P<0.05; ** P<0.01.
Fig. 3
Fig. 3. Effects of RTA 405 on basal arterial blood pressure in conscious rats
Sprague Dawley rats were administered sesame oil or RTA 405 at a dose of 100 mg/kg body weight by oral gavage once daily for three consecutive days. Diastolic and systolic blood pressure was measured using tail cuff in conscious vehicle- and RTA 405-treated rats before treatment (D0) and 8 hours post-dose on Day 3 (D3). Fifteen rats in each group. Data are expressed as mean ± SD.
Fig. 4
Fig. 4. Effect of RTA 405 on freshly isolated rat glomerular volume in response to Ang II (1 μM)
Rats were treated with RTA 405 at 100 mg/kg body weight or the same volume of sesame oil through an oral gavage for 3 consecutive days. A. Representative images, showing glomeruli before Ang II and 20 min after Ang II. Scale bars represent 50 μm. B. Summary data from 13 glomeruli isolated from 4 control rats and 14 glomeruli isolated from 4 RTA 405 treated rats. * P<0.05, RTA 405 vs. Control. n indicates the number of glomeruli analyzed in each group.
Fig. 5
Fig. 5. Inhibition of RTA 405 on Ang II-induced contraction of human MCs
Cells were treated with either DMSO or various concentrations of RTA 405 for ~16 hours at 37°C. A: * P<0.05, compared with DMSO. The numbers on top of bars indicate the cell number for analysis in each group. B: Percent inhibition was calculated by normalizing responses in the RTA 405-treated cells to the response in DMSO-treated cells. The data was fit to a sigmoidal curve with 4 parameters and IC50 was calculated as a function of the fitting curve.
Fig. 6
Fig. 6. Effect of Bardoxolone methyl on Ang II-induced contraction of human MCs
A. Representative morphology of MCs before and 30 min after 1 μM Ang II stimulation. Cells were treated with DMSO (vehicle) or bardoxolone methyl (BARD) at 500 nM for ~16 h at 37°C. B. Dose dependent effect of bardoxolone methyl on Ang II-induced MC contraction. Cells were treated with DMSO or various concentrations of bardoxolone methyl for ~16 h at 37°C. UT, untreated; * P<0.05, compared with DMSO group. The numbers in bars indicate the number of cells analyzed. C. Time course effect of bardoxolone methyl on Ang II-induced MC contraction. MCs were treated with either DMSO or bardoxolone methyl at 500 nM for different time periods at 37°C. * P<0.05, compared with both 0 and 3 min groups. The numbers inside bars indicate the number of cells analyzed. D: Percent inhibition was calculated by normalizing responses in bardoxolone methyl-treated cells to the response in DMSO-treated cells. The data was fit to a sigmoidal curve with 3 parameters and IC50 was calculated as a function of the fitting curve.
Fig. 7
Fig. 7. Effect of RTA 405 on Ang II-induced Ca2+ response in human MCs
A. Representative traces, showing [Ca2+]i in response to 1 μM Ang II in MCs without treatment (UT) or treated with DMSO at 1:1000 dilution or RTA 405 at 100 nM for ~16 h, or with losartan at 5 μM for 5 min, or with PEG-catalase at 300 unit/ml for 30 min. [Ca2+]B indicates the Ca2+ concentration in bathing solution. B. Summarized Ca2+ increases in response to Ang II from experiments presented in A. Δ[Ca2+]i was calculated by subtracting [Ca2+]i before application of Ang II from the peak [Ca2+]i after application of Ang II. The numbers inside the parentheses represent the number of cells analyzed. * P<0.01, compared with both UT and DMSO groups.
Fig. 8
Fig. 8. Effect of RTA 405 on intracellular ROS production in human MCs
A. Basal intracellular ROS levels in MCs treated with either DMSO at 1:1000 dilution or RTA 405 (RTA) at100 nM for ~16 h. DCF-indicated intracellular ROS levels were measured with a fluorescence plate reader and were expressed as percent changes from the fluorescence intensity in MCs without treatment. * P<0.05, compared with DMSO group. B. Production of intracellular ROS in response to Ang II (1 μM) in MCs without treatment (UT) or treated with DMSO at 1:1000 dilution or RTA 405 at 100 nM for ~16 h at 37°C, or treated with losartan at 5 μM for 5 min at room temperature. The intracellular ROS levels in all groups were expressed as percent changes in fluorescence intensity from the level in MCs without any treatment. * P<0.05, compared with baseline; †: * P<0.05, compared with both UT and DMSO groups. The numbers inside parentheses represent the number of experiments repeated in each group.
Fig. 9
Fig. 9. Bardoxolone methyl and RTA 405 induced expression of Nrf2 target genes in cultured MCs
Human MCs (A) and rat mesangial cells (B) were treated with the indicated concentrations of bardoxolone methyl or RTA 405 for 16 hours. Cells were harvested for RNA isolation and cDNA synthesis, and Nrf2 target gene expression was evaluated by real-time PCR. Fold-change values (relative to DMSO-treated samples) are the average of three independent experiments. Nqo1: NAD(P)H dehydrogenase quinone 1; Hmox1: heme oxygenase 1; Gclc: glutamate-cysteine ligase, catalytic subunit; Txnrd1: thioredoxin reductase 1. Error bars represent standard deviation.error of the mean. * P<0.05; ** P<0.01; *** P<0.001; **** P<.<0.0001 vs. 0 nM. NS; not significant.
Fig. 10
Fig. 10. The mechanistic pathway for inhibition of Ang II-induced MC contraction by synthetic triterpenoids
In MCs, Ang II generates ROS by activating NADPH oxdiases (NOX) through AT1 receptor signaling pathway. ROS subsequently raises [Ca2+]i either by stimulating Ca2+ release from endoplastic reticulum (ER)/sarcoplastic reticulum (SR) or by acutely activating Ca2+ permeable channels in the plasma membrane or both. An elevation of intracellular Ca2+ level triggers MC contraction and eventually results in a decrease in GFR. Synthetic triterpenoids bind to Keap1 in the cytoplasm of MC, which activates the Nrf2 transcription factor. In the nucleus of MCs, activated Nrf2 then promotes transcription of a variety of genes encoding antioxidant enzymes. The increased abundance of antioxidant enzymes reduces intracellular ROS produced by the Ang II signaling pathway, and consequently maintains an intracellular redox balance during Ang II stimulation (for simplicity, a classical Ang II-AT1 receptor signaling pathway was omitted).

Comment in

References

    1. Townsend RR, Feldman HI. Chronic kidney disease progression. NephSAP. 2009;8:271–288.
    1. O'Hare AM, Choi AI, Bertenthal D, et al. Age affects outcomes in chronic kidney disease. J Am Soc Nephrol. 2007;18:2758–2765. - PubMed
    1. Levin A, Djurdjev O, Beaulieu M, et al. Variability and risk factors for kidney disease progression and death following attainment of stage 4 CKD in a referred cohort. Am J Kidney Dis. 2008;52:661–671. - PubMed
    1. Townsend RR, Feldman HI. Chronic kidney disease: past problems, current challenges, and future facets. NephSAP. 2009;8:239–243.
    1. Lewis EJ, Hunsicker LG, Bain RP, et al. The effect of angiotensin-converting enzyme inhibition on diabetic nephropathy. N Engl J Med. 1993;329:1456–1462. - PubMed

Publication types

MeSH terms