. 2012 Dec;17(12):126017.
doi: 10.1117/1.JBO.17.12.126017.

Longitudinal in vivo monitoring of rodent glioma models through thinned skull using laser speckle contrast imaging

Affiliations

Longitudinal in vivo monitoring of rodent glioma models through thinned skull using laser speckle contrast imaging

Abhishek Rege et al. J Biomed Opt. 2012 Dec.

Abstract

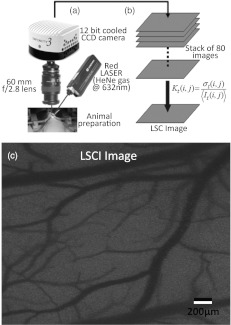
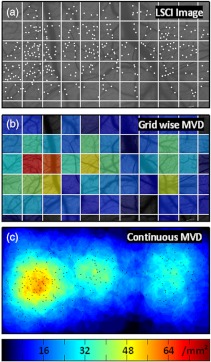
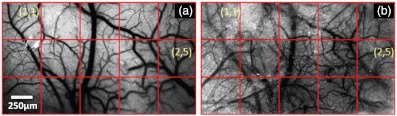
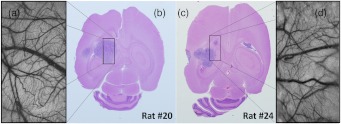
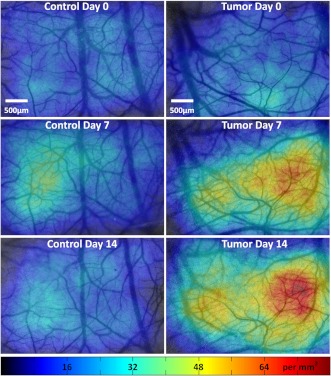
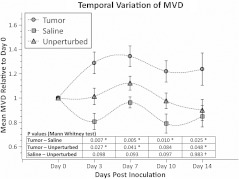
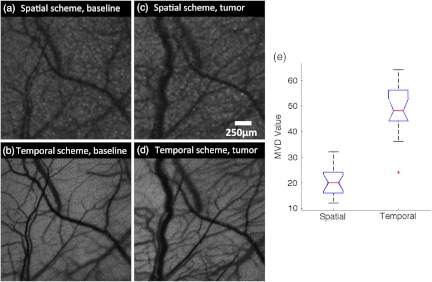
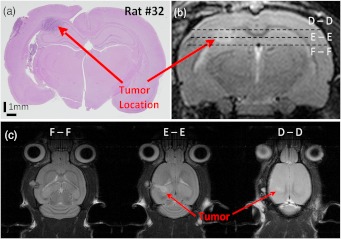
Laser speckle contrast imaging (LSCI) is a contrast agent free imaging technique suited for longitudinal assessment of vascular remodeling that accompanies brain tumor growth. We report the use of LSCI to monitor vascular changes in a rodent glioma model. Ten rats are inoculated with 9L gliosarcoma cells, and the angiogenic response is monitored five times over two weeks through a thinned skull imaging window. We are able to visualize neovascularization and measure the number of vessels per unit area to assess quantitatively the microvessel density (MVD). Spatial spread of MVD reveals regions of high MVD that may correspond to tumor location. Whole-field average MVD values increase with time in the tumor group but are fairly stable in the control groups. Statistical analysis shows significant differences in MVD values between the tumor group and both saline-receiving and unperturbed control groups over the two-week period (p<0.05). In conclusion, LSCI is suitable for investigation of tumor angiogenesis in rodent models. In addition, the statistical difference (p<0.02) between MVD values of the tumor (24.40 ± 1.41) and control groups (15.40 ± 1.60) on the 14th day after inoculation suggests a potential use of LSCI in the clinic in distinguishing tumor environments from normal vasculature.


Figures

Fig. 1
Fig. 1
Laser speckle contrast imaging of brain microvasculature. (a) Raw laser speckle images of an anesthetized rat’s brain are obtained through the thinned skull using a 12-bit cooled CCD camera under red laser illumination. (b) The acquired raw laser speckle images are processed using a temporal processing scheme to obtain an LSCI image. (c) The calculated LSCI image is a high-resolution wide-field image detailing microvessel structure.
Fig. 2
Fig. 2
Estimation and display of MVD. (a) An example LSCI image of the rat’s cerebral vasculature, overlaid with a virtual grid for MVD estimation. Each square of the grid is 0.5  mm×0.5  mm. The white dots indicate vessel intersection points and endpoints that have been manually picked toward MVD estimation. (b) The MVD count in pseudo color in each square of the grid. MVD is calculated by counting the number of vessel endpoints and intersection points in each square and multiplying by four (so that MVD is expressed per mm2). (c) A continuous spatial map of MVD values calculated in a circular 0.2-mm2 neighborhood around every pixel. The black dots in (c) correspond to the white dots in (a).
Fig. 3
Fig. 3
LSCI images reveal long-term vascular remodeling. LSCI images of the rat brain region of interest obtained (a) on the day of tumor inoculation and (b) 10 days after inoculation. The two images have been registered manually, and the entire area has been broken down into a 3×5 square grid labeled (1,1) to (3,5).
Fig. 4
Fig. 4
Confirming tumor location under imaging window using histology. H&E staining was used to confirm tumor location. (a) and (d) show the LSCI images acquired of the region of interest before sacrifice. (b) and (c) clearly show the tumor on day 14 in the axial section with the box indicating the location of the imaging window with respect to the whole brain and tumor. The presence of tumor under the imaging window was used as a criterion for inclusion of data in the tumor group.
Fig. 5
Fig. 5
Spatiotemporal comparison of MVD values in tumor-bearing and control rats. The images show continuous MVD maps overlaid on the cerebral vasculature of an animal from the unperturbed control group (left panel) and the tumor-bearing group (right panel) on days 0, 7, and 14 after baseline imaging and/or tumor injection. All images are scaled to the same color map (as indicated). The change in MVD over time in the control animal is small, whereas a steep increase in MVD is observed in the tumor-bearing animal.
Fig. 6
Fig. 6
Longitudinal variation of MVD over the course of tumor growth. Three groups—tumor (n=10), saline controls (n=6), and unperturbed controls (n=11)—were monitored using LSCI over two weeks since the day of inoculation (day 0). The plot shows means and standard error bars of the MVD averaged over the ROI and normalized to its corresponding baseline MVD value on day 0. The inset table shows results (p value) of a Mann Whitney U test performed to compare the three experimental groups pairwise. The asterisk indicates statistical significance (p<0.05) between groups. The dagger indicates that the day 14 MVD of the saline and unperturbed groups belong to the same distribution.
Fig. 7
Fig. 7
Demonstration of the utility of LSCI with a temporal processing scheme to identify tumor-associated neovasculature. Baseline LSCI images of rat cerebral vasculature were taken using (a) traditional/spatial processing and (b) temporal processing. Equivalent (c) spatially and (d) temporally processed LSCI images were taken after the tumor was grown for several days. Note the improved resolution of (b) versus (a) and (d) versus (c). Also note the neovascularization evident in comparing (d) with (b). (e) A statistical comparison of the utility of the two schemes for microvessel identification. The median and quartiles are plotted for MVD values measured (n=15). Images have been scaled uniformly and linearly to improve print reproduction.
Fig. 8
Fig. 8
The site of tumor inoculation. (a) Coronal section stained with H&E. (b) Coronal T2 weighted MRI section. These images confirm that the glioma cells were inoculated at a depth of approximately 2 mm from the surface. (c) Transverse T2 weighted MRI sections confirm the tumor mass extends to within 1.5 mm from the surface (section D-D). All images shown were obtained on day 14.

References

    1. Ayata C., et al. , “Laser speckle flowmetry for the study of cerebrovascular physiology in normal and ischemic mouse cortex,” J. Cereb. Blood Flow Metab. 24(7), 744–755 (2004).JCBMDN10.1097/01.WCB.0000122745.72175.D5 - DOI - PubMed
    1. Briers J. D., Webster S., “Laser speckle contrast analysis (LASCA): a nonscanning, full-field technique for monitoring capillary blood flow,” J. Biomed. Opt. 1(2), 174–179 (1996).JBOPFO10.1117/12.231359 - DOI - PubMed
    1. Murari K., et al. , “Contrast-enhanced imaging of cerebral vasculature with laser speckle,” App. Opt. 46(22), 5340–5346 (2007).APOPAI10.1364/AO.46.005340 - DOI - PubMed
    1. Li N., et al. , “High spatiotemporal resolution imaging of the neurovascular response to electrical stimulation of rat peripheral trigeminal nerve as revealed by in vivo temporal laser speckle contrast,” J. Neurosci. Methods 176(2), 230–236 (2009).JNMEDT10.1016/j.jneumeth.2008.07.013 - DOI - PubMed
    1. Folkman J., “Tumor angiogenesis: therapeutic implications,” N. Engl. J. Med. 285(21), 1182–1186 (1971).NEJMBH10.1056/NEJM197111182852108 - DOI - PubMed

Publication types