. 2013 Mar;109(5):1283-95.
doi: 10.1152/jn.00718.2012. Epub 2012 Dec 12.

Coding of repetitive transients by auditory cortex on posterolateral superior temporal gyrus in humans: an intracranial electrophysiology study

Affiliations

Coding of repetitive transients by auditory cortex on posterolateral superior temporal gyrus in humans: an intracranial electrophysiology study

Kirill V Nourski et al. J Neurophysiol. 2013 Mar.

Abstract

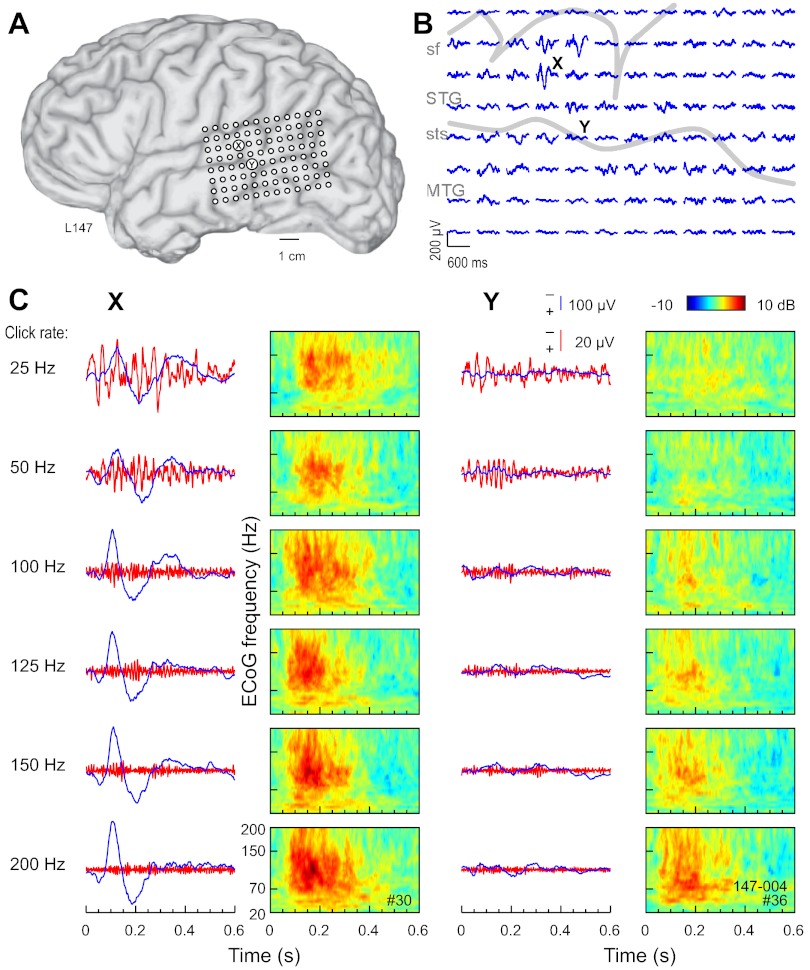
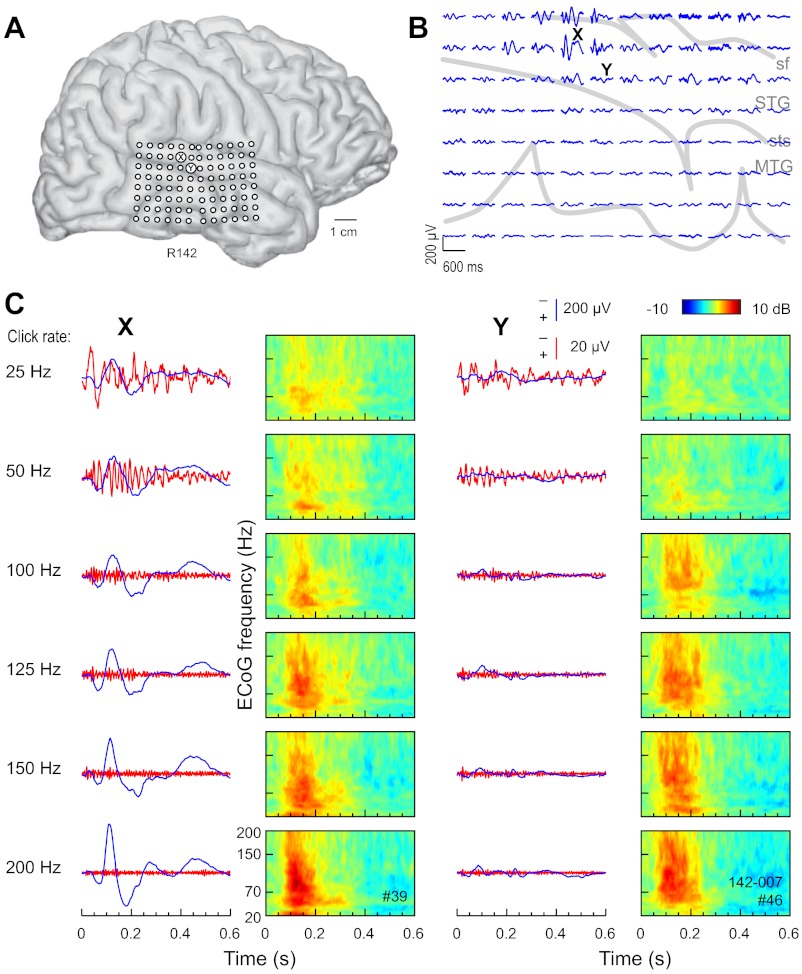
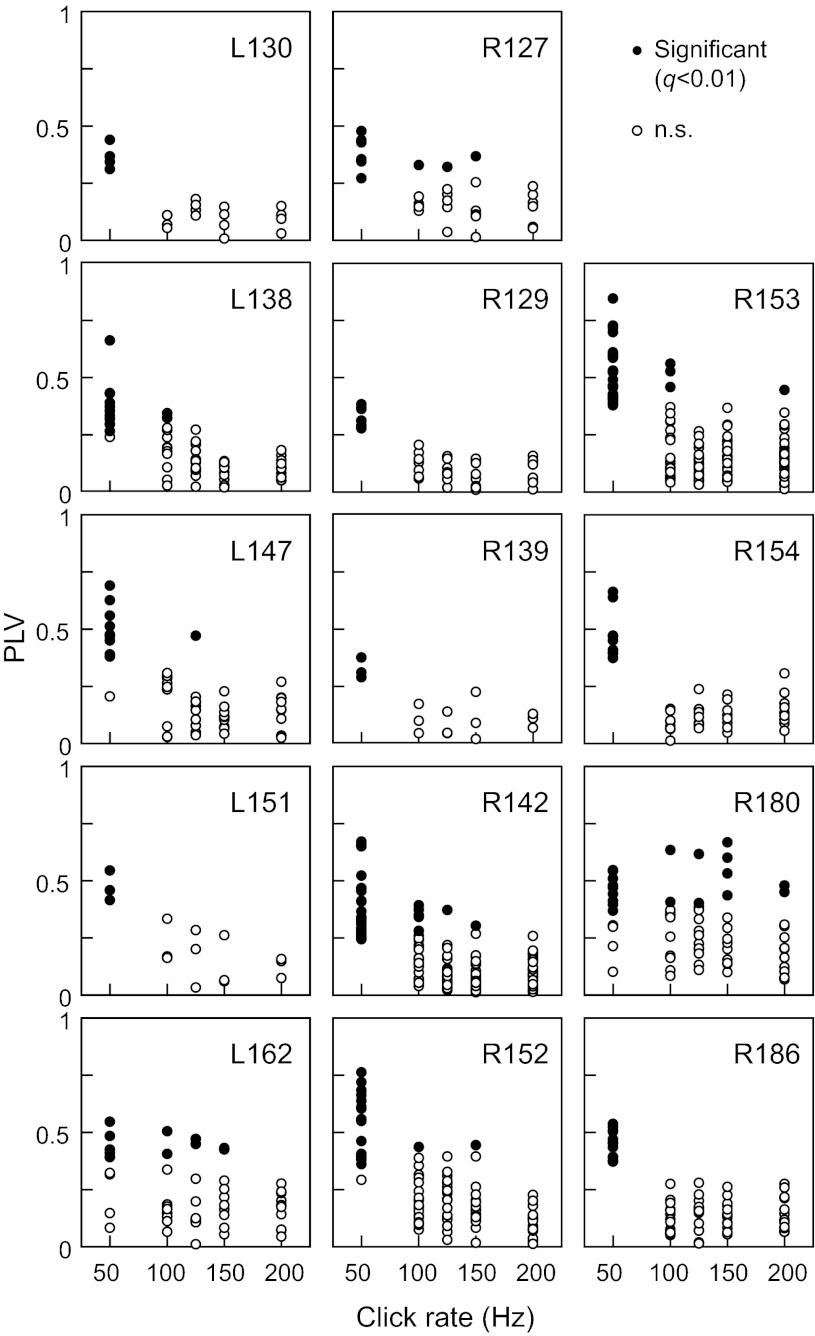
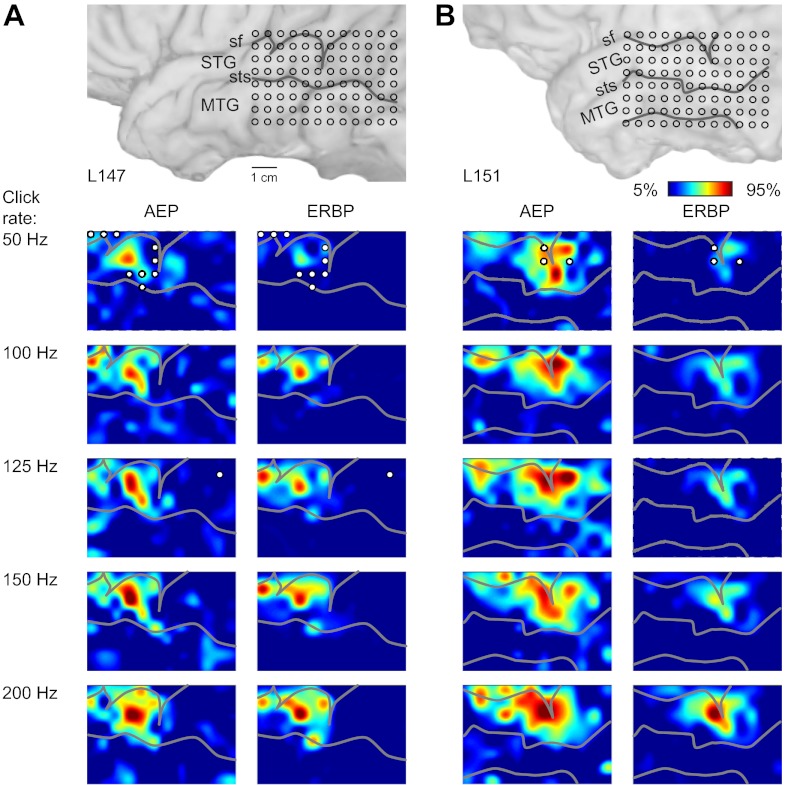
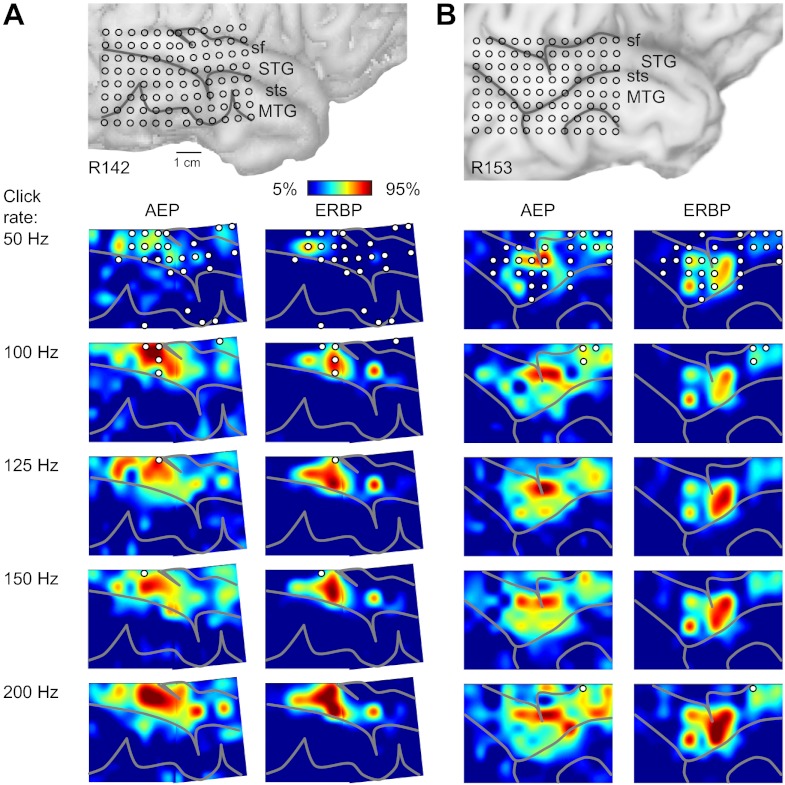
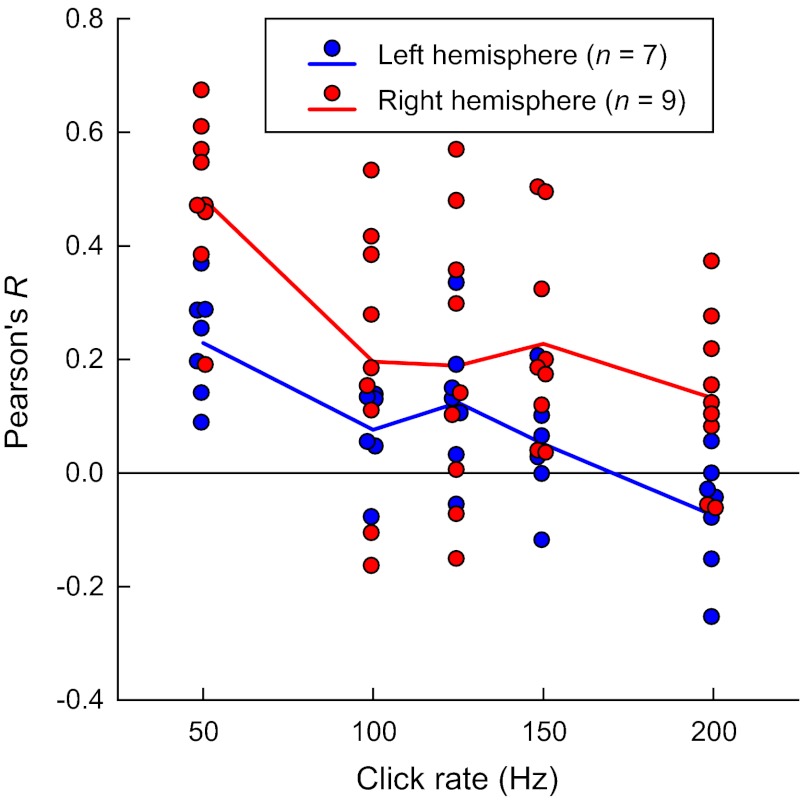
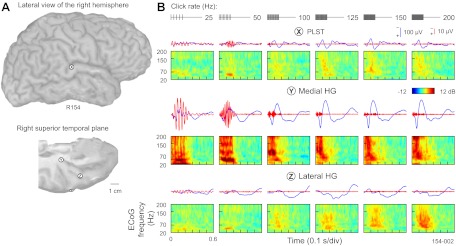
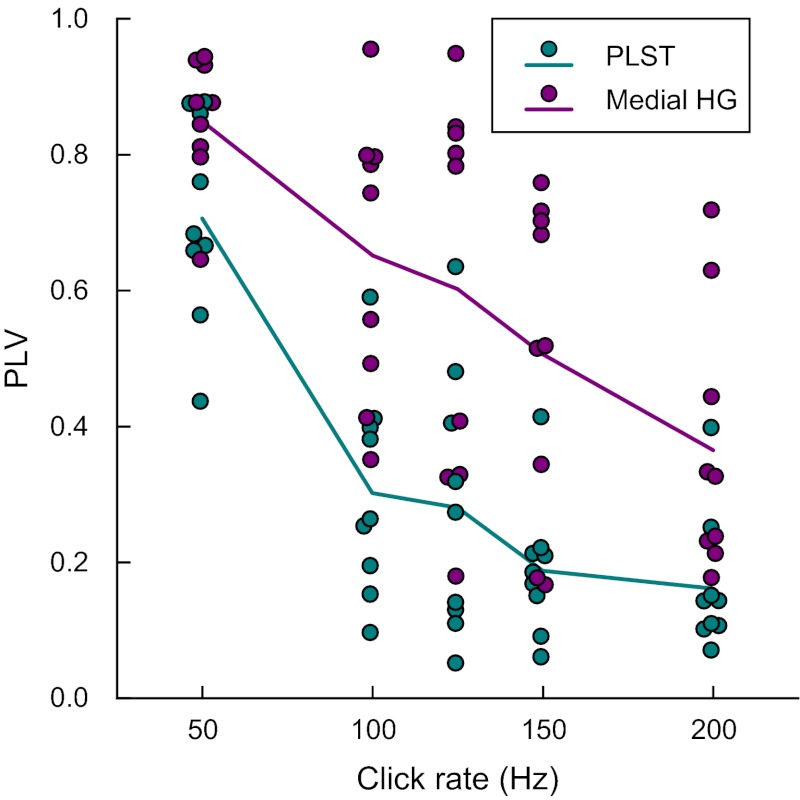
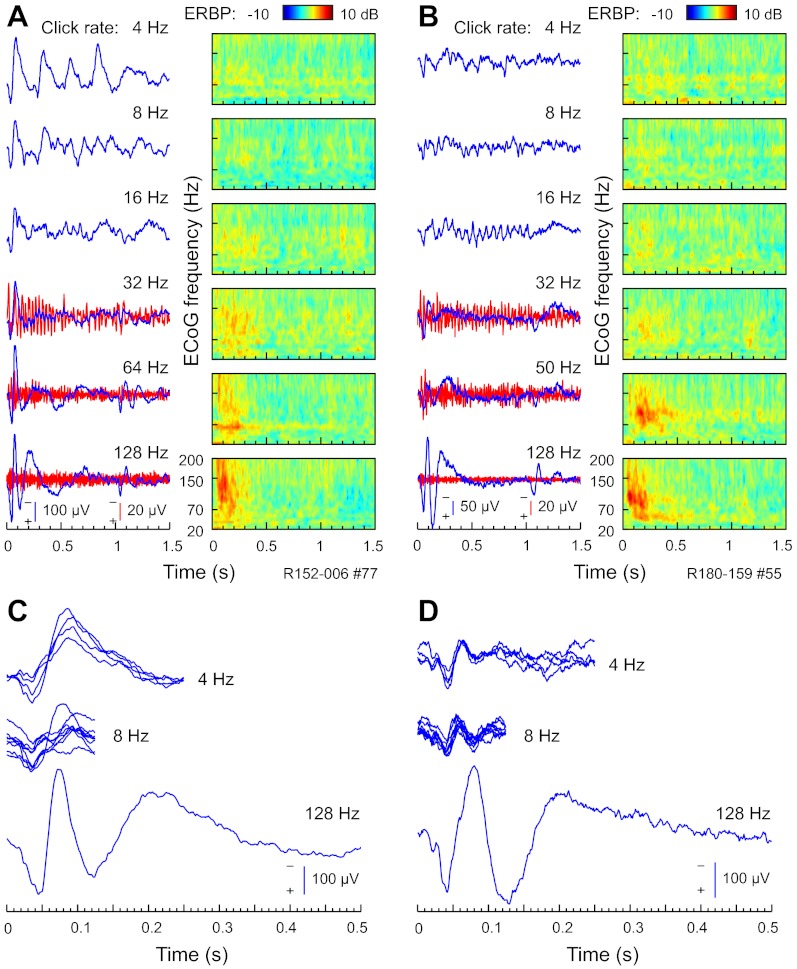
Evidence regarding the functional subdivisions of human auditory cortex has been slow to converge on a definite model. In part, this reflects inadequacies of current understanding of how the cortex represents temporal information in acoustic signals. To address this, we investigated spatiotemporal properties of auditory responses in human posterolateral superior temporal (PLST) gyrus to acoustic click-train stimuli using intracranial recordings from neurosurgical patients. Subjects were patients undergoing chronic invasive monitoring for refractory epilepsy. The subjects listened passively to acoustic click-train stimuli of varying durations (160 or 1,000 ms) and rates (4-200 Hz), delivered diotically via insert earphones. Multicontact subdural grids placed over the perisylvian cortex recorded intracranial electrocorticographic responses from PLST and surrounding areas. Analyses focused on averaged evoked potentials (AEPs) and high gamma (70-150 Hz) event-related band power (ERBP). Responses to click trains featured prominent AEP waveforms and increases in ERBP. The magnitude of AEPs and ERBP typically increased with click rate. Superimposed on the AEPs were frequency-following responses (FFRs), most prominent at 50-Hz click rates but still detectable at stimulus rates up to 200 Hz. Loci with the largest high gamma responses on PLST were often different from those sites that exhibited the strongest FFRs. The data indicate that responses of non-core auditory cortex of PLST represent temporal stimulus features in multiple ways. These include an isomorphic representation of periodicity (as measured by the FFR), a representation based on increases in non-phase-locked activity (as measured by high gamma ERBP), and spatially distributed patterns of activity.


Figures

Fig. 1.
Fig. 1.
Auditory cortical responses to click-train stimuli recorded from the left hemisphere in a representative subject. A: location of the 96-contact subdural grid. B: all-pass (1.6- to 500-Hz bandpass) averaged evoked potential (AEP) waveforms recorded from the subdural grid in response to 160-ms, 100-Hz click trains. Negative voltage is plotted upward. Sulcal patterns are indicated by gray outlines. MTG, middle temporal gyrus; sf, sylvian fissure; STG, superior temporal gyrus; sts, superior temporal sulcus. C: All-pass (1.6–500 Hz) and high-pass (cut-off 1 octave below driving frequency) AEP waveforms (blue and red traces, respectively) and time-frequency analysis of electrocorticogram (ECoG; color plots) recorded in response to click trains presented at rates between 25 and 200 Hz (top to bottom). Data from 2 recording sites, indicated by X (at which the AEP of greatest amplitude was recorded) and Y (that was some distance away, and where the AEP was of lower amplitude), are shown.
Fig. 2.
Fig. 2.
Auditory cortical responses to click-train stimuli recorded from the right hemisphere in a representative subject. See legend of Fig. 1 for details.
Fig. 3.
Fig. 3.
Phase locking to click trains recorded from 14 subjects. Phase-locking values (PLVs) are plotted as functions of click rate. In each subject, data from sites that exhibited significant phase locking (q < 0.01) to at least 1 stimulus rate out of 5 are shown.
Fig. 4.
Fig. 4.
Spatial distribution of cortical responses to click trains recorded from the left hemisphere in 2 representative subjects (shown in A and B). In each panel, location of the recording grid is shown on the top, followed by cortical activation maps across click rates (top-to-bottom rows), as measured by AEP root mean square (RMS) amplitude and high gamma event-related band power (ERBP; left and right columns, respectively). AEP RMS amplitudes were calculated within 0–300 ms after stimulus onset; high gamma ERBP was averaged within 50–250 ms after stimulus onset for each recording site, normalized relative to the maximum values across stimuli in each subject and smoothed using cubic interpolation. Sulcal patterns are shown by gray lines. Circles indicate sites that exhibited significant (at q = 0.01) PLVs at each stimulus rate.
Fig. 5.
Fig. 5.
Spatial distribution of cortical responses to click trains recorded from the right hemisphere in 2 representative subjects (shown in A and B). See legend of Fig. 4 for details.
Fig. 6.
Fig. 6.
Correlation between high gamma ERRP and PLV at different click rates. Data from 96 contact subdural grids implanted in the left hemisphere in 7 subjects (blue circles) and in the right hemisphere in 9 other subjects (red circles). Blue and red lines represent mean Pearson's R values for left- and right-hemisphere cases, respectively. A small amount of variability was added to the abscissa values to make individual data points more visible.
Fig. 7.
Fig. 7.
Comparison of responses to click trains between PLST and 2 recording locations within Heschl's gyrus (HG). A: location of 3 exemplary recording sites—a representative PLST site, a presumed core cortex site in medial HG, and a site in a nonprimary field on lateral HG (marked by X, Y, and Z, respectively) in a representative subject. B: AEPs, FFRs, and ERBP obtained from PLST, core auditory cortex in medial HG, and a non-core field in lateral HG (top to bottom). Stimuli: 160-ms click trains, presented at rates between 25 and 200 Hz (left to right). Stimulus schematics are shown in top rows.
Fig. 8.
Fig. 8.
Phase locking in medial HG and PLST. Summary of data from 9 subjects (L145, L162, L178, R149, R152, R153, R154, R180, and R186). PLVs are plotted as functions of click rate for sites within PLST and medial HG (teal and purple circles, respectively). Data from 1 medial HG and 1 PLST site that exhibited the highest PLVs at 50 Hz in each subject are shown. Purple and teal lines represent across-subject mean PLVs for medial HG and PLST sites, respectively. A small amount of variability was added to the abscissa values to make individual data points more visible.
Fig. 9.
Fig. 9.
PLST responses to 1-s click trains. A and B: all-pass (1.6–500 Hz) and high-pass (cut-off 1 octave below driving frequency) AEP waveforms (blue and red traces, respectively) and ERBP (color plots), elicited by click trains of rates between 4 and 128 Hz (top to bottom). Exemplary data from 2 representative right-hemisphere sites in 2 different subjects (R152 and R180, A and B, respectively). At a relatively low rate of 4 Hz, each click in the train evoked a distinct AEP complex (top plots in A and B). C and D: AEP waveforms recorded in response to 4- and 8-Hz click trains are replotted by fragmenting and superimposing the portions of the AEP waveform that were recorded between consecutive clicks in the click train. The 1st 500 ms of the AEP waveforms elicited by 128-Hz click trains is plotted below.

Similar articles

Cited by

References

    1. Bao S, Chang EF, Woods J, Merzenich MM. Temporal plasticity in the primary auditory cortex induced by operant perceptual learning. Nat Neurosci 7: 974–981, 2004 - PubMed
    1. Benjamini Y, Drai D, Elmer G, Kafkari N, Golani I. Controlling the false discovery rate in behavior genetics research. Behav Brain Res 125: 279–284, 2001 - PubMed
    1. Benjamini Y, Hochberg Y. Controlling the false discovery rate: a practical and powerful approach to multiple testing. J Royal Stat Soc B Methodol 57: 289–300, 1995
    1. Brugge JF, Nourski KV, Oya H, Reale RA, Kawasaki H, Steinschneider M, Howard MA., III Coding of repetitive transients by auditory cortex of Heschl's gyrus of human. J Neurophysiol 102: 2358–2374, 2009 - PMC - PubMed
    1. Brugge JF, Volkov IO, Garell PC, Reale RA, Howard MA., III Functional connections between auditory cortex on Heschl's gyrus and on the lateral superior temporal gyrus in humans. J Neurophysiol 90: 3750–3763, 2003 - PubMed

Publication types