. 2013 Mar;109(6):1548-70.
doi: 10.1152/jn.00237.2012. Epub 2012 Dec 12.

Neural control of muscle force: indications from a simulation model

Affiliations

Neural control of muscle force: indications from a simulation model

Paola Contessa et al. J Neurophysiol. 2013 Mar.

Abstract

We developed a model to investigate the influence of the muscle force twitch on the simulated firing behavior of motoneurons and muscle force production during voluntary isometric contractions. The input consists of an excitatory signal common to all the motor units in the pool of a muscle, consistent with the "common drive" property. Motor units respond with a hierarchically structured firing behavior wherein at any time and force, firing rates are inversely proportional to recruitment threshold, as described by the "onion skin" property. Time- and force-dependent changes in muscle force production are introduced by varying the motor unit force twitches as a function of time or by varying the number of active motor units. A force feedback adjusts the input excitation, maintaining the simulated force at a target level. The simulations replicate motor unit behavior characteristics similar to those reported in previous empirical studies of sustained contractions: 1) the initial decrease and subsequent increase of firing rates, 2) the derecruitment and recruitment of motor units throughout sustained contractions, and 3) the continual increase in the force fluctuation caused by the progressive recruitment of larger motor units. The model cautions the use of motor unit behavior at recruitment and derecruitment without consideration of changes in the muscle force generation capacity. It describes an alternative mechanism for the reserve capacity of motor units to generate extraordinary force. It supports the hypothesis that the control of motoneurons remains invariant during force-varying and sustained isometric contractions.


Figures

Fig. 1.
Fig. 1.
Model schematic. The input to the muscle force model is the common net excitation to the motoneuron pool (A), which determines the “operating point” on the firing rate spectrum (B) and the firing rate values of the active motor units. These values are transformed into noisy firing trains, which are convolved with the time-dependent and firing rate-dependent motor unit force twitches (C) to compute the force contribution of each active motor unit. Motor unit forces are summed to obtain the muscle output force (D), which is compared with the target force (E). The tracking error between output and target force is used to adjust the input excitation. See text for additional details. MU, motor units.
Fig. 2.
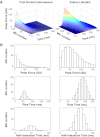
Fig. 2.
Top: firing rate spectrum of the first dorsal interosseous (FDI) and vastus lateralis (VL) muscles showing the mean firing rate values (in pulses per second, pps) of the motor units as a function of the excitation to the motoneuron pool and the motor unit recruitment threshold. The red vertical line indicates a given level of input excitation or “operating point” of the motoneuron pool. It intersects the firing rate trajectories of the active motor units (displayed in blue) at the point of their average firing rate. The gray trajectories on the right side represent the potential firing rate values of motor units if the operating point of the muscles shifts to higher excitation levels. Note that the firing rates of only 1 of every 2 motor units (of 120) in the FDI and 1 of every 6 motor units (of 600) in the VL are displayed for clarity. Bottom: histogram of the recruitment thresholds (as a percentage of the maximal value, %max) for the motor units in the motoneuron pool of the FDI and the VL muscles. The range of recruitment threshold is from 0 to maximal (τmax): τmax = 67% for the FDI and τmax = 95% for the VL.
Fig. 3.
Fig. 3.
A: impulse trains generated for motor units 1, 30, 60, 90, and 120 in the FDI muscle during a 0.5-s isometric voluntary contraction sustained at 20% (top) and 100% (bottom) maximal excitation. IPI, interpulse interval. B: impulse trains modified with superimposed Gaussian noise, representing the synaptic noise. C: noisy impulse trains scaled on the basis of the firing rate-dependent gain function presented in Eqs. 13 and 14. D: motor unit force twitch. E: motor unit forces obtained by convolving the impulse trains in C with their respective force twitch in D. F: output muscle force generated from the summation of all motor units active in the FDI muscle at the set excitation level. Note that motor unit force twitches and motor unit forces of each muscle are on the same scale.
Fig. 4.
Fig. 4.
A: force twitches modeled with Eqs. 3–7 for motor units in the FDI and VL muscle. Note that the force twitches of only 1 of every 2 motor units in the FDI and 1 of every 6 motor units in the VL are displayed for clarity. Higher-threshold higher-amplitude motor units show progressively shorter time duration. AU,. arbitrary units. B: histograms of the 3 parameters characterizing the force twitch for the FDI and VL muscles: peak tension (force), rise time, and half-relaxation time.
Fig. 5.
Fig. 5.
A and B: initial 60-s epoch (top) and subsequent 60-s epoch (bottom) of a simulated contraction sustained at a constant excitation value for the FDI (A) and VL muscles (B). Left panels present the firing rate spectrum of the muscles; the red line indicates the value of input excitation, or the operating point. Middle panels contain the mean firing rates of the active motor units during the 60-s epochs. Only 1 of every 6 motor units is displayed for clarity. Right panels show the simulated output force (as a percentage of maximum voluntary contraction, %MVC) in blue and the input excitation in red. A 10-s enlarged view of the force is presented in the box insets. The whole muscle force twitch at the beginning and at the end of the epoch, with amplitude normalized to that at the beginning of the contraction, is presented in gray shading at the top of the right panels. In the absence of force feedback, the excitation to the motoneuron pool remains constant, as do the number of active motor units and their firing rate value. The muscle force twitch increases during the first 60 s or less as a result of potentiation, leading to increased simulated output force. It subsequently decreases as the contraction is sustained and the muscle fatigues, leading to a decrease in the simulated force output. Note that the simulated muscle force is smoother for the VL than for the FDI.
Fig. 6.
Fig. 6.
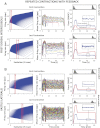
A and B: simulated contraction sustained at a constant force value for the FDI (A) and VL muscles (B). The first 60-s epoch of the contraction (top) and the last 60-s epoch before the endurance limit (bottom) are presented. Data are presented in a similar manner as in Fig. 5. Left panels now present 2 red lines indicating the value of input excitation, or operating point, at the beginning (solid line) and at the end (dotted line) of the epochs. With force feedback, the excitation to the motoneuron pool decreases in the first 60-s epoch, following the increase in muscle force twitch amplitude and leading to decreased firing rates of the active motor units and derecruitment of several motor units. The opposite phenomena occur as the contraction is sustained longer and are presented for the last 60-s epoch before the endurance limit. The force remains at the constant target value throughout the simulation and presents a marked increase in force fluctuations.
Fig. 7.
Fig. 7.
A and B: simulated intermittent contraction series for the FDI (A) and VL muscles (B). The first (top) and last contraction of the series before the endurance limit (bottom) are presented. The simulation mimics the experimental protocol of Adam and De Luca (2003, 2005). Data are presented in a similar manner as in Fig. 6. Note that the simulation was able to track the force increasing segment of the contraction as well as the constant force segment. During the constant force segment of the first contraction, the excitation to the motoneuron pool decreases due to the increase in muscle force twitch amplitude, causing a decrease in the firing rates of the active motor units and derecruitment of several motor units. The opposite phenomena occur as the contraction is sustained longer. The force remains at the constant target value throughout the simulation and presents a marked increase in force fluctuations.
Fig. 8.
Fig. 8.
A comparison between the empirical data (top) from Adam and De Luca (2005) and those simulated from the model for an equivalent protocol (bottom). Note the similarity. In both cases the firing rates decrease slightly during the first contractions; they subsequently increase up to the endurance limit. Additional later-recruited lower-firing-rate motor units are recruited as time progresses. The thick black lines represent the simulated (top) and empirical (bottom) modulating amplitude of the whole muscle force twitch, which potentiates slightly during the first contraction and then decreases to the endurance limit. Refer to the text for additional details.
Fig. 9.
Fig. 9.
An example of 2 motor units being derecruited during the early phase of a 50% MVC constant-force isometric contraction from the VL muscle (unpublished data). The colored lines indicate the firing rates of the coactive motor units, and the dark line represents the produced force.
Fig. 10.
Fig. 10.
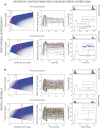
A and B: simulated intermittent contraction series for the FDI (A) and VL muscles (B) with delayed tracking error correction. The first (top) and last contraction of the series before the endurance limit (bottom) are presented. Data are presented in a similar manner as in Fig. 7. Note that the motor unit behavior and the muscle force behavior show patterns similar to those presented in Fig. 7. Refer to the text for additional details.
Fig. A1.
Fig. A1.
Simulated intermittent contraction series for the FDI muscle with the pattern of time-dependent change in the amplitude of the force twitches applied to all active motor units as a function of their individual activation time instead of the contraction time (as in Fig. 7). The first (top) and last contraction of the series before the endurance limit (bottom) are presented. Data are presented in a similar manner as in Fig. 7. Note that the motor unit behavior and the muscle force behavior show patterns similar to those presented in Fig. 7. Refer to the text for additional details.
Fig. A2.
Fig. A2.
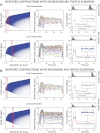
Simulated intermittent contraction series for the FDI muscle as the motor unit twitch duration shortens (A) and lengthens (B) with contraction time. The first (top) and last contraction of the series before the endurance limit (bottom) are presented. Data are presented in a similar manner as in Fig. 7. Note that the motor unit behavior and the muscle force behavior show patterns qualitatively similar to those presented in Fig. 7. Refer to the text for additional details.
Fig. A3.
Fig. A3.
Left: force-frequency relations obtained from previously performed experiment in the FDI of 6 subjects (top) and in the VL muscle of 3 subjects (bottom). Colored lines represent individual subjects; black line indicates the averaged data. Right: firing rate-dependent gain function calculated for the 2 muscles from the fitted force-frequency curves and Eqs. 13–14.

References

    1. Adam A. Control of Motor Units During Submaximal Fatiguing Contractions (PhD thesis). Boston, MA: Boston University, 2003
    1. Adam A, De Luca CJ. Recruitment order of motor units in human vastus lateralis muscle is maintained during fatiguing contractions. J Neurophysiol 90: 2919–2927, 2003 - PubMed
    1. Adam A, De Luca CJ. Firing rates of motor units in human vastus lateralis muscle during fatiguing isometric contractions. J Appl Physiol 99: 268–280, 2005 - PubMed
    1. Basmajian JV, De Luca CJ. Muscles Alive (5th ed). Baltimore, MD: Williams and Wilkins, 1985
    1. Bawa P, Stein RB. Frequency response of human soleus muscle. J Neurophysiol 39: 788–793, 1976 - PubMed

Publication types

LinkOut - more resources