

Infiltrating macrophages are key to the development of seizures following virus infection
- PMID: 23236075
- PMCID: PMC3554195
- DOI: 10.1128/JVI.02747-12
Infiltrating macrophages are key to the development of seizures following virus infection
Abstract
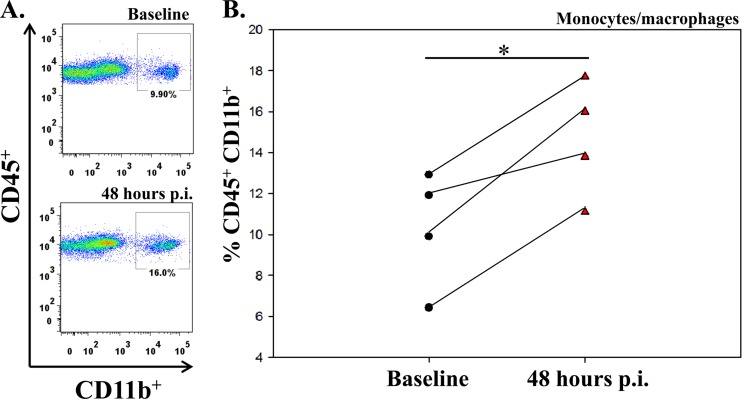
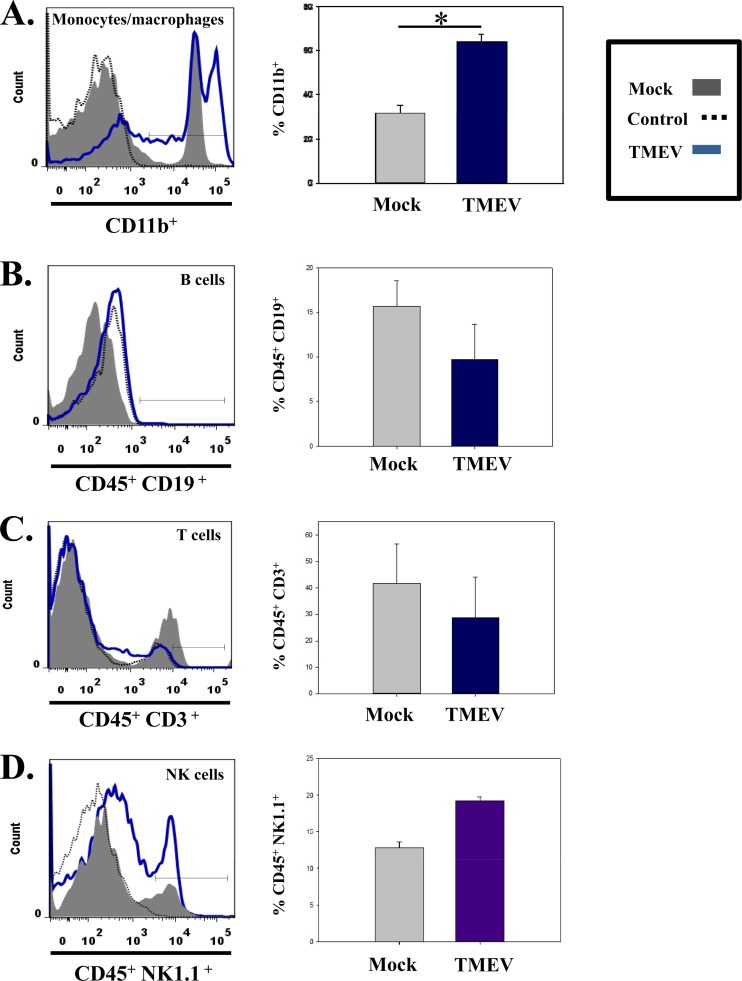
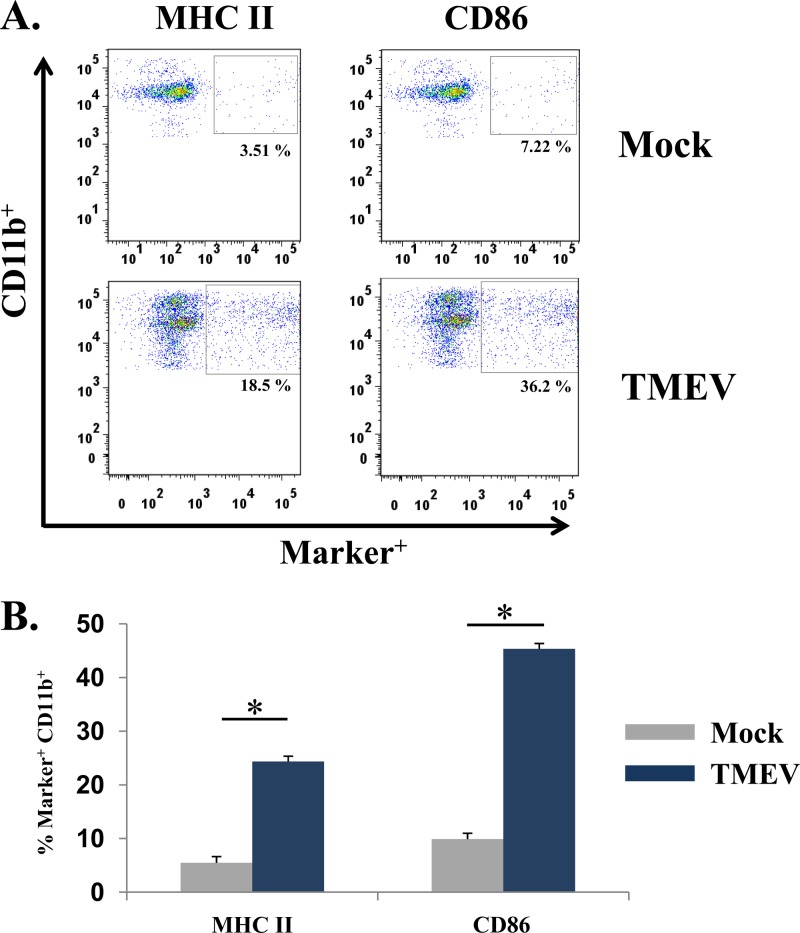
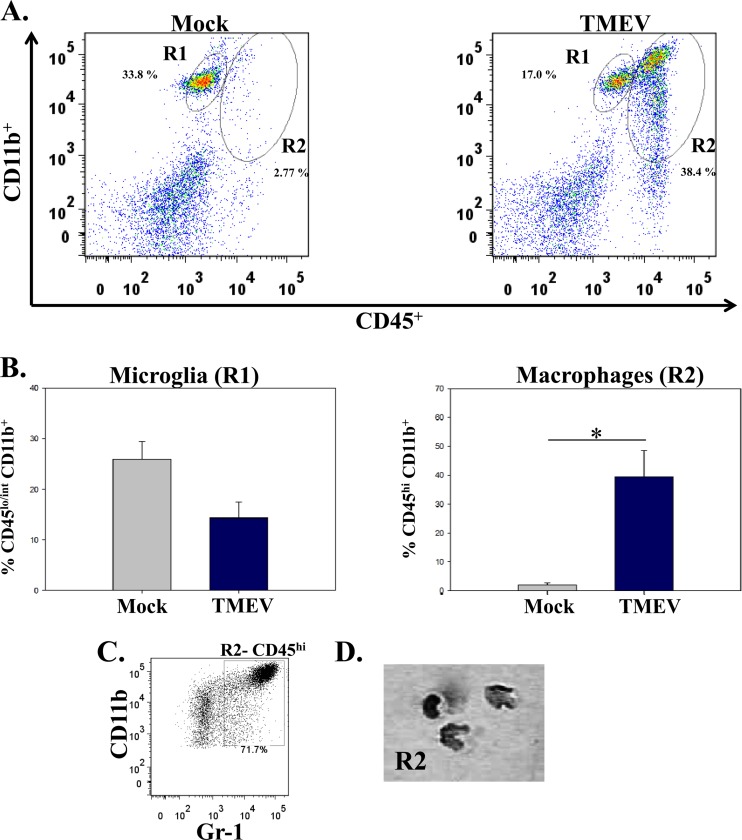
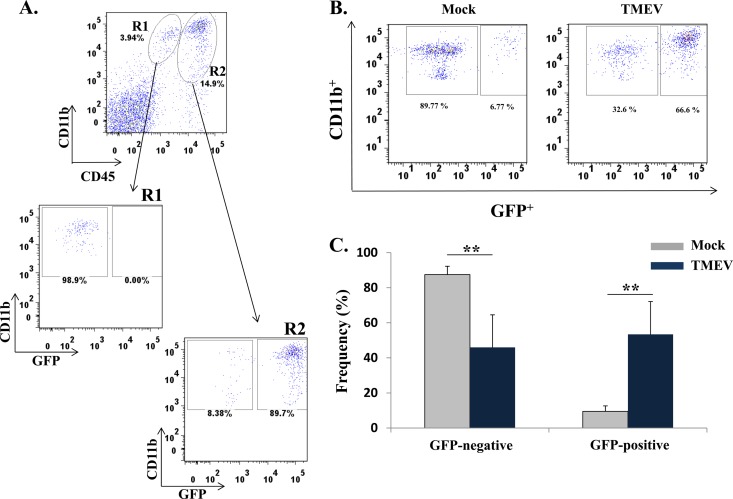
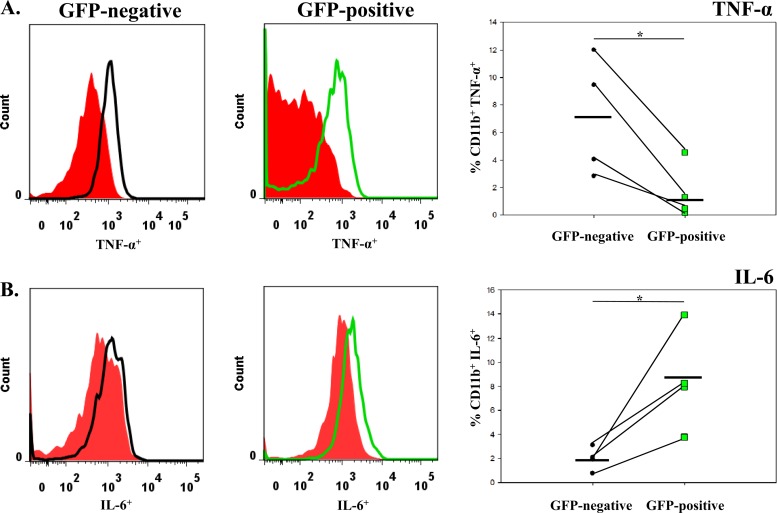
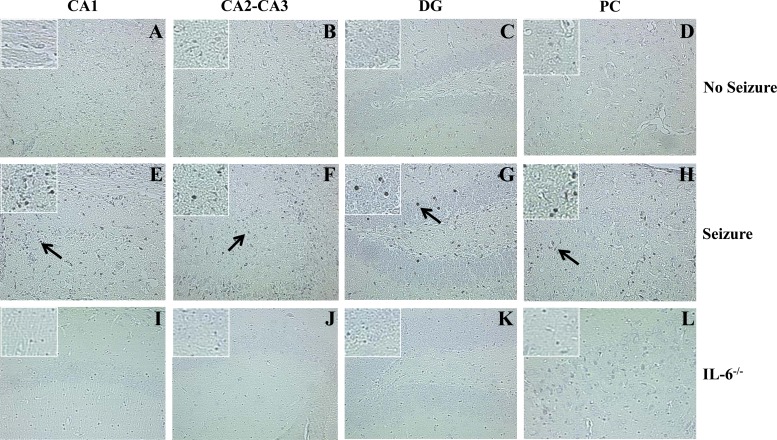
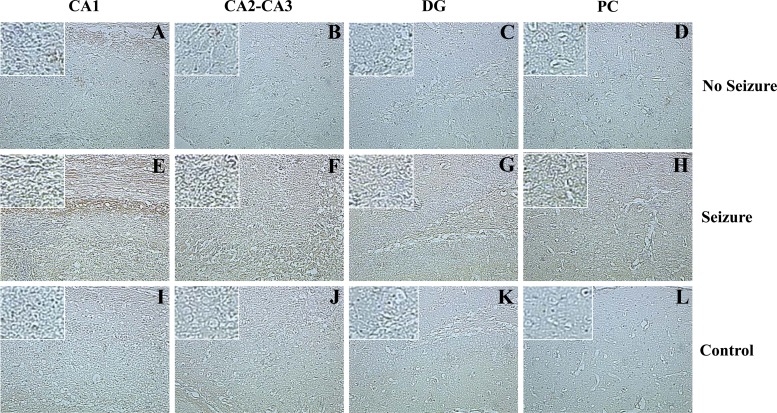
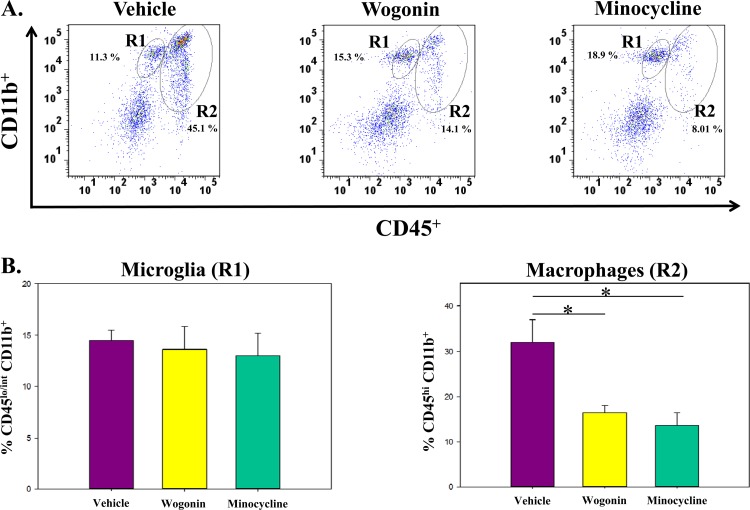
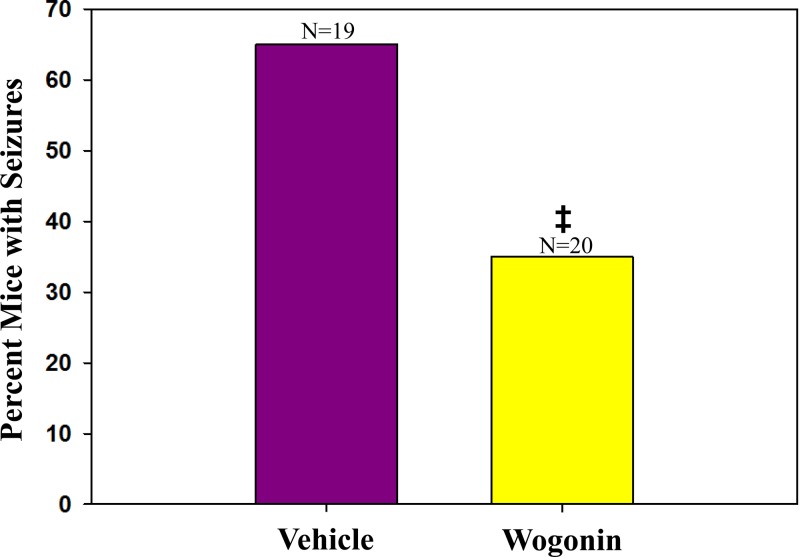
Viral infections of the central nervous system (CNS) can trigger an antiviral immune response, which initiates an inflammatory cascade to control viral replication and dissemination. The extent of the proinflammatory response in the CNS and the timing of the release of proinflammatory cytokines can lead to neuronal excitability. Tumor necrosis factor alpha (TNF-α) and interleukin-6 (IL-6), two proinflammatory cytokines, have been linked to the development of acute seizures in Theiler's murine encephalomyelitis virus-induced encephalitis. It is unclear the extent to which the infiltrating macrophages versus resident CNS cells, such as microglia, contribute to acute seizures, as both cell types produce TNF-α and IL-6. In this study, we show that following infection a significantly higher number of microglia produced TNF-α than did infiltrating macrophages. In contrast, infiltrating macrophages produced significantly more IL-6. Mice treated with minocycline or wogonin, both of which limit infiltration of immune cells into the CNS and their activation, had significantly fewer macrophages infiltrating the brain, and significantly fewer mice had seizures. Therefore, our studies implicate infiltrating macrophages as an important source of IL-6 that contributes to the development of acute seizures.
Figures
Similar articles
-
The role of peripheral interleukin-6 in the development of acute seizures following virus encephalitis.J Neurovirol. 2017 Oct;23(5):696-703. doi: 10.1007/s13365-017-0554-8. Epub 2017 Jul 24. J Neurovirol. 2017. PMID: 28741149 Free PMC article.
-
Microglia are activated to become competent antigen presenting and effector cells in the inflammatory environment of the Theiler's virus model of multiple sclerosis.J Neuroimmunol. 2003 Nov;144(1-2):68-79. doi: 10.1016/j.jneuroim.2003.08.032. J Neuroimmunol. 2003. PMID: 14597100
-
Once initiated, viral encephalitis-induced seizures are consistent no matter the treatment or lack of interleukin-6.J Neurovirol. 2011 Oct;17(5):496-9. doi: 10.1007/s13365-011-0050-5. Epub 2011 Aug 11. J Neurovirol. 2011. PMID: 21833798 Free PMC article.
-
Theiler's virus persistence in the central nervous system of mice is associated with continuous viral replication and a difference in outcome of infection of infiltrating macrophages versus oligodendrocytes.Virus Res. 2005 Aug;111(2):214-23. doi: 10.1016/j.virusres.2005.04.010. Virus Res. 2005. PMID: 15893838 Review.
-
The Contribution of Microglia and Brain-Infiltrating Macrophages to the Pathogenesis of Neuroinflammatory and Neurodegenerative Diseases during TMEV Infection of the Central Nervous System.Viruses. 2024 Jan 13;16(1):119. doi: 10.3390/v16010119. Viruses. 2024. PMID: 38257819 Free PMC article. Review.
Cited by
-
Brain-Derived Neurotrophic Factor Inhibits the Function of Cation-Chloride Cotransporter in a Mouse Model of Viral Infection-Induced Epilepsy.Front Cell Dev Biol. 2022 Jul 8;10:961292. doi: 10.3389/fcell.2022.961292. eCollection 2022. Front Cell Dev Biol. 2022. PMID: 35874836 Free PMC article.
-
Indoleamine 2,3-dioxygenase 1 deletion promotes Theiler's virus-induced seizures in C57BL/6J mice.Epilepsia. 2019 Apr;60(4):626-635. doi: 10.1111/epi.14675. Epub 2019 Feb 15. Epilepsia. 2019. PMID: 30770561 Free PMC article.
-
Diet composition and sterilization modifies intestinal microbiome diversity and burden of Theiler's virus infection-induced acute seizures.bioRxiv [Preprint]. 2023 Oct 17:2023.10.17.562694. doi: 10.1101/2023.10.17.562694. bioRxiv. 2023. Update in: Epilepsia. 2024 Jun;65(6):1777-1790. doi: 10.1111/epi.17946. PMID: 37905123 Free PMC article. Updated. Preprint.
-
Intact interleukin-10 receptor signaling protects from hippocampal damage elicited by experimental neurotropic virus infection of SJL mice.Sci Rep. 2018 Apr 17;8(1):6106. doi: 10.1038/s41598-018-24378-z. Sci Rep. 2018. PMID: 29666403 Free PMC article.
-
Neuropeptide Y Negatively Influences Monocyte Recruitment to the Central Nervous System during Retrovirus Infection.J Virol. 2015 Dec 30;90(6):2783-93. doi: 10.1128/JVI.02934-15. J Virol. 2015. PMID: 26719257 Free PMC article.
References
-
- Verboon-Maciolek MA, Krediet TG, Gerards LJ, de Vries LS, Groenendaal F, van Loon AM. 2008. Severe neonatal parechovirus infection and similarity with enterovirus infection. Pediatr. Infect. Dis. J. 27:241–245 - PubMed
-
- Verboon-Maciolek MA, Krediet TG, Gerards LJ, Fleer A, van Loon TM. 2005. Clinical and epidemiologic characteristics of viral infections in a neonatal intensive care unit during a 12-year period. Pediatr. Infect. Dis. J. 24:901–904 - PubMed
-
- Wolthers KC, Benschop KS, Schinkel J, Molenkamp R, Bergevoet RM, Spijkerman IJ, Kraakman HC, Pajkrt D. 2008. Human parechoviruses as an important viral cause of sepsis-like illness and meningitis in young children. Clin. Infect. Dis. 47:358–363 - PubMed
-
- Libbey JE, Kirkman NJ, Smith MCP, Tanaka T, Wilcox KS, White HS, Fujinami RS. 2008. Seizures following picornavirus infection. Epilepsia 49:1066–1074 - PubMed
Publication types
MeSH terms
Substances
Grants and funding
LinkOut - more resources
Full Text Sources
Other Literature Sources
Medical
