. 2012 Dec 26;109(52):E3631-9.
doi: 10.1073/pnas.1216256110. Epub 2012 Dec 11.

Decoding the rules of recruitment of excitatory interneurons in the adult zebrafish locomotor network

Affiliations

Decoding the rules of recruitment of excitatory interneurons in the adult zebrafish locomotor network

Jessica Ausborn et al. Proc Natl Acad Sci U S A. .

Abstract

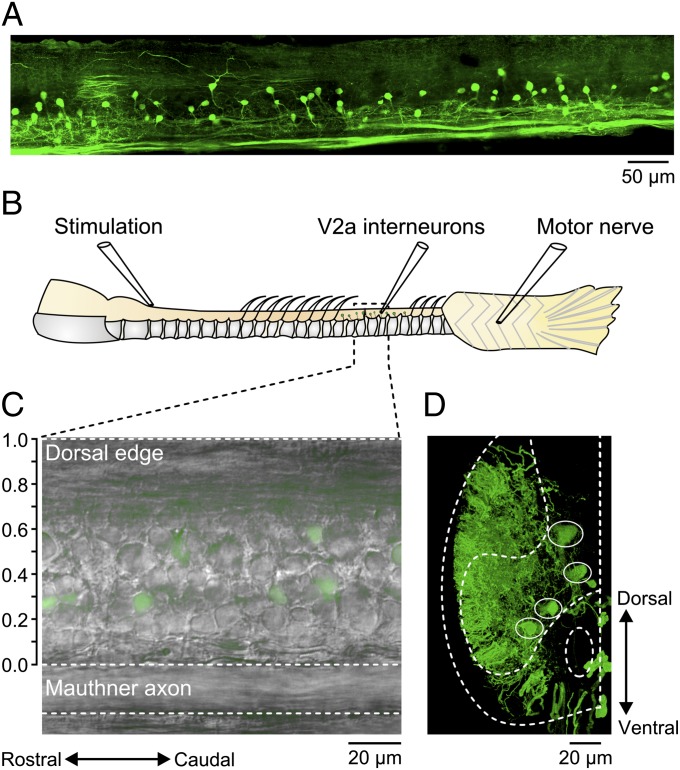
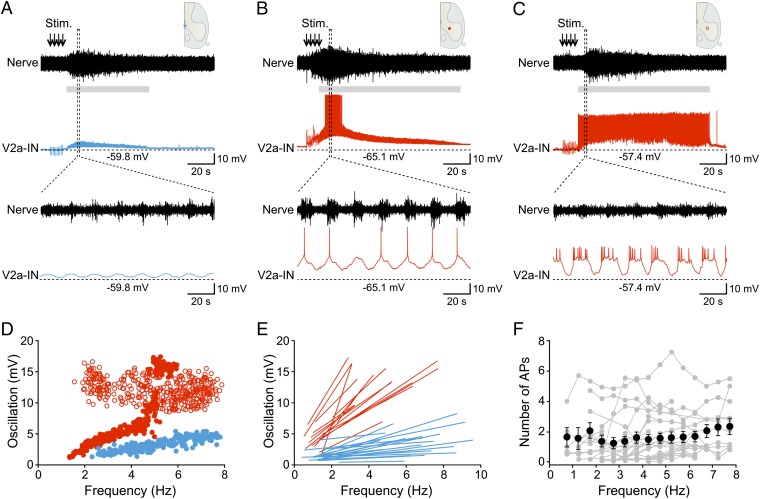
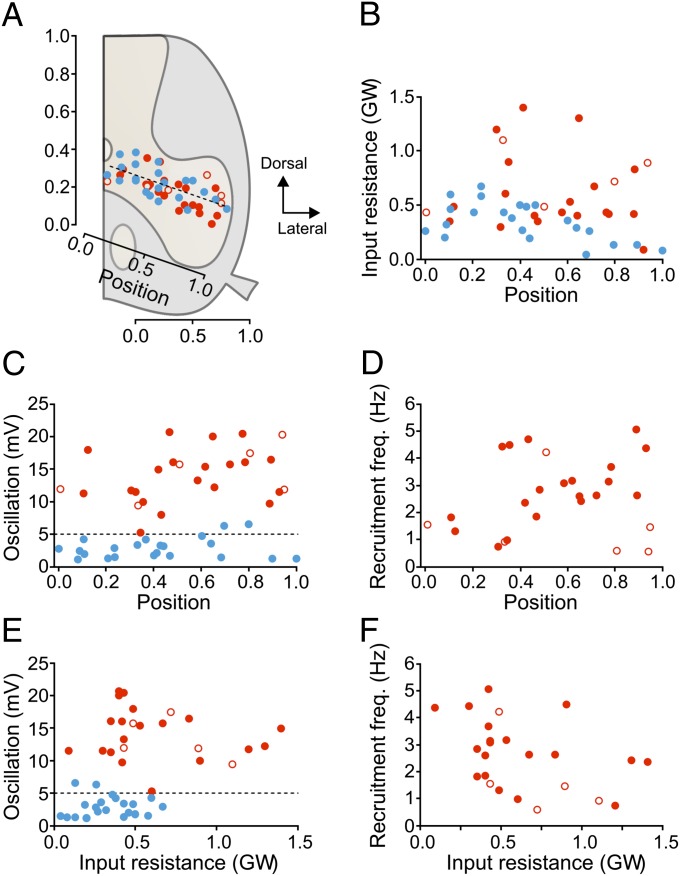
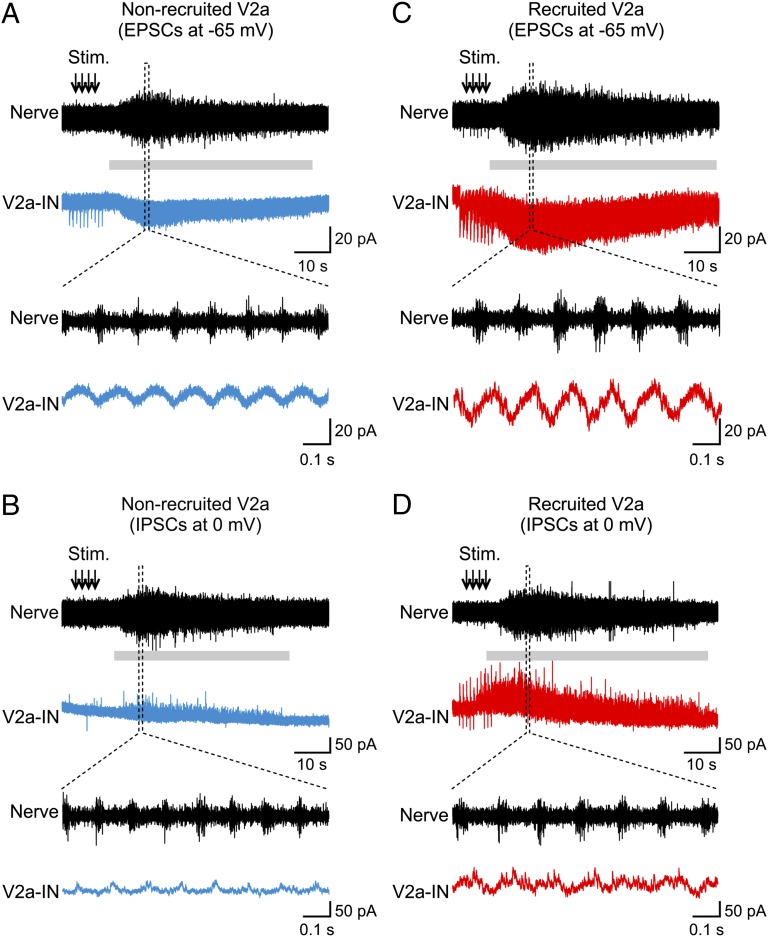
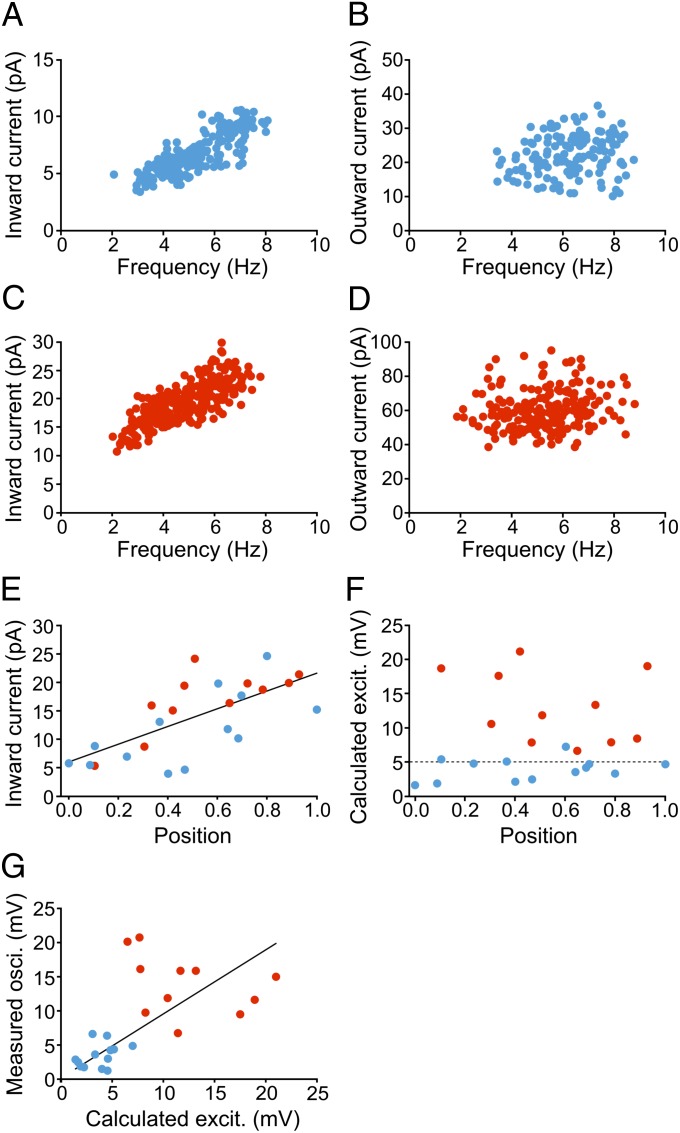
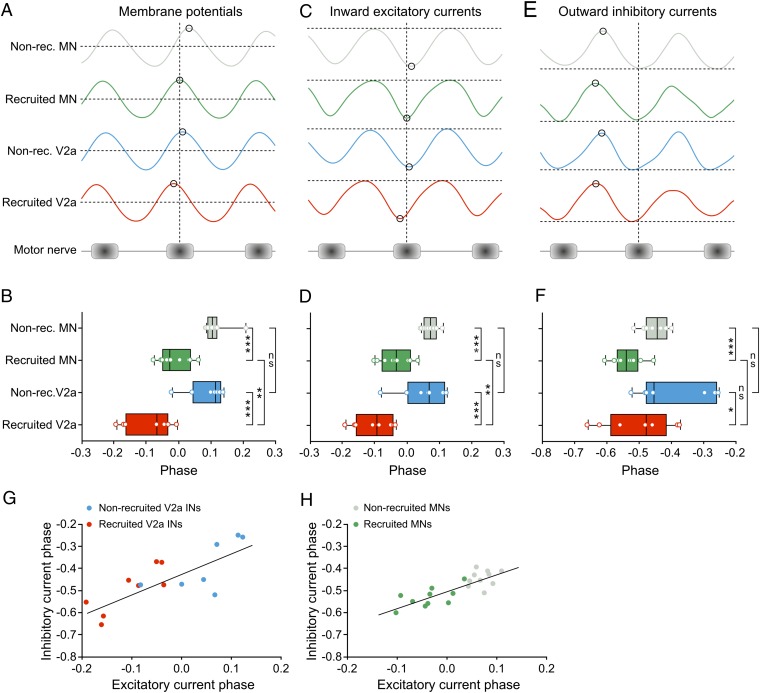
Neural networks in the spinal cord transform signals from the brain into coordinated locomotor movements. An optimal adjustment of the speed of locomotion entails a precise order of recruitment of interneurons underlying excitation within these networks. However, the mechanisms encoding the recruitment threshold of excitatory interneurons have remained unclear. Here we show, using a juvenile/adult zebrafish preparation, that excitatory V2a interneurons are incrementally recruited with increased swimming frequency. The order of recruitment is not imprinted by the topography or the input resistance of the V2a interneurons. Rather, it is determined by scaling the effect of excitatory synaptic currents by the input resistance. We also show that the locomotor networks are composed of multiple microcircuits encompassing subsets of V2a interneurons and motoneurons that are recruited in a continuum with increased swimming speeds. Thus, our results provide insights into the organization and mechanisms determining the recruitment of spinal microcircuits to ensure optimal execution of locomotor movements.


Conflict of interest statement

The authors declare no conflict of interest.

Figures

Fig. 1.
Fig. 1.
Experimental setup and distribution of V2a interneurons. (A) Lateral view of a reconstructed spinal cord showing the distribution of V2a interneurons along the dorsoventral and rostrocaudal axis. (B) Schematic drawing of the in vitro brainstem/spinal cord preparation. (C) Overlay of DIC and fluorescence images showing V2a interneurons expressing GFP. The vertical scale axis shows how the soma position is measured using the normalized distance between the dorsal edge of the Mauthner axon and the dorsal edge of the spinal cord. (D) Transverse section of the spinal cord showing the dorsoventral and mediolateral distribution of V2a interneurons (circles). Dashed lines mark the spinal cord outline and the position of the Mauthner axon.
Fig. 2.
Fig. 2.
Incremental recruitment of V2a interneurons with increased swimming frequency. (A) Recording from a V2a interneuron displaying only subthreshold locomotor-related membrane potential oscillations (blue) and a corresponding nerve recording (black). (B) Recording from a V2a interneuron transiently recruited during the swimming episode (red) and a corresponding nerve recording (black). (C) Recording from a V2a interneuron recruited continuously during the entire swimming episode (red) and a corresponding nerve recording (black). (A–C Insets) Position of the recorded interneurons in the spinal cord. Gray bars indicate the duration of the swimming episode. IN, interneuron. (D) Incremental increase in the peak-to-trough amplitude of the locomotor-driven membrane potential oscillations as a function of swimming frequency of the V2a interneurons in A (blue circles), B (filled red circles), and C (open red circles). (E) Slopes of the change in subthreshold locomotor-driven membrane potential oscillations from all nonrecruited (blue) and transiently recruited (red) V2a interneurons. Linear-fit lines cover the entire swimming episode for nonrecruited V2a interneurons. In transiently recruited V2a the linear fit lines cover all subthreshold locomotor cycles. (F) Plot showing the number of action potentials (APs) as a function of swimming frequency. Gray circles indicate individual neurons; black circles indicate averages from all neurons).
Fig. 3.
Fig. 3.
The recruitment pattern of V2a interneurons is not topographically ordered. Blue circles indicate nonrecruited V2a interneurons; filled red circles indicate transiently recruited V2a interneurons; open red circles indicate continuously recruited V2a interneurons. (A) Lack of a topographic organization of recruited vs. nonrecruited V2a interneurons. (B) Plot of the input resistance of V2a interneurons as a function of the relative soma position (0: extreme dorsomedial; 1: extreme ventrolateral position within the population). (C) Plot of the average peak-to-trough amplitude of locomotor-related membrane potential oscillations (at 4–5 Hz swimming frequency) as a function of the relative soma position. Almost all the recruited V2a interneurons displayed locomotor-related membrane potential oscillations with amplitudes above 5 mV (dashed line). (D) Plot of the minimum recruitment frequency as a function of the relative soma position. (E) Plot of the average peak-to-trough amplitude of locomotor-related membrane potential oscillations (at 4–5 Hz swimming frequency) as a function of the input resistance of recruited and nonrecruited V2a interneurons. (F) Plot of the minimum recruitment frequency as a function of the input resistance.
Fig. 4.
Fig. 4.
On-cycle excitatory and mid-cycle inhibitory currents in V2a interneurons. Nerve recordings are shown in black and intracellular recordings in blue (for a nonrecruited V2a interneuron) or red (for a recruited V2a interneuron). Gray bars indicate the duration of the swimming episode. (A) On-cycle excitatory currents recorded in a nonrecruited V2a interneuron during a swimming episode. (B) Mid-cycle inhibitory currents recorded in the interneuron shown in A during a swimming episode. (C) On-cycle excitatory currents recorded in a recruited V2a interneuron during a swimming episode. (D) Mid-cycle inhibitory currents recorded in the interneuron shown in C.
Fig. 5.
Fig. 5.
Tuning the effect of synaptic currents encodes the order of recruitment of V2a interneurons. Blue circles indicate nonrecruited V2a interneurons; red circles indicate recruited V2a interneurons. (A–D) Graphs showing the change in the amplitude with swimming frequency of excitatory and inhibitory currents in a nonrecruited (blue circles) and a recruited (red circles) V2a interneuron. Data in these graphs are from the interneurons in Fig. 4. (E) Linear correlation (R2 = 0.43) between the excitatory current amplitude and the relative soma position of V2a interneurons. (F) Graph showing the calculated excitatory inputs of V2a interneurons as a function of the relative soma position. The combination of the input resistance and the excitatory currents in each V2a interneuron predicts the 5-mV cut between nonrecruited and recruited V2a interneurons (dashed line). (G) The calculated excitation correlates well (R2 = 0.33) with the measured locomotor-related membrane potential oscillations during swimming.
Fig. 6.
Fig. 6.
Temporal relationship between V2a interneurons and motoneurons. (A) Cross-correlations showing the timing of the peak depolarization of the locomotor-related membrane potential oscillations (black circles) in recruited (red trace) and nonrecruited (blue trace) V2a interneurons and motoneurons (green traces) in relation to the activity in the peripheral motor nerve (schematically illustrated). (B) Box-and-whisker plot showing the average phase of the peak amplitude of locomotor-related membrane potential oscillations in the different neurons normalized to the cycle duration measured at the peripheral motor nerve. (C) Temporal relationship of the peak excitatory current (black circles) in recruited (red trace) and nonrecruited (blue trace) V2a interneurons and motoneurons (green traces) in relation to the activity of the peripheral motor nerve. (D) Box-and-whisker plot showing the average phase of the peak amplitude of the excitatory currents normalized to the cycle duration. (E) Temporal relationship of the peak inhibitory current (black circles) in recruited (red trace) and nonrecruited (blue trace) V2a interneurons and motoneurons (green traces) in relation to the activity of the peripheral motor nerve. (F) Box-and-whisker plot showing the average phase of the peak amplitude of the inhibitory current normalized to the cycle duration. The dashed lines in A, C, and E represent the baseline membrane potential or current. (G and H) The timing of excitatory and inhibitory currents covaries linearly in V2a interneurons (Ins) (R2 = 0.55) (G) and motoneurons (MN) (R2 = 0.67) (H).

Comment in

  • Spinal cord: Speeding up locomotion.
    Flight MH. Flight MH. Nat Rev Neurosci. 2013 Feb;14(2):78-9. doi: 10.1038/nrn3435. Epub 2013 Jan 9. Nat Rev Neurosci. 2013. PMID: 23299060 No abstract available.

Similar articles

Cited by

References

    1. Büschges A, Scholz H, El Manira A. New moves in motor control. Curr Biol. 2011;21(13):R513–R524. - PubMed
    1. Fetcho JR, Higashijima S, McLean DL. Zebrafish and motor control over the last decade. Brain Res Brain Res Rev. 2008;57(1):86–93. - PMC - PubMed
    1. Grillner S. The motor infrastructure: From ion channels to neuronal networks. Nat Rev Neurosci. 2003;4(7):573–586. - PubMed
    1. Grillner S, Jessell TM. Measured motion: Searching for simplicity in spinal locomotor networks. Curr Opin Neurobiol. 2009;19(6):572–586. - PMC - PubMed
    1. Kiehn O. Locomotor circuits in the mammalian spinal cord. Annu Rev Neurosci. 2006;29:279–306. - PubMed

Publication types

LinkOut - more resources