. 2012;8(12):e1003065.
doi: 10.1371/journal.pgen.1003065. Epub 2012 Dec 6.

Recurrent targeted genes of hepatitis B virus in the liver cancer genomes identified by a next-generation sequencing-based approach

Affiliations

Recurrent targeted genes of hepatitis B virus in the liver cancer genomes identified by a next-generation sequencing-based approach

Dong Ding et al. PLoS Genet. 2012.

Abstract

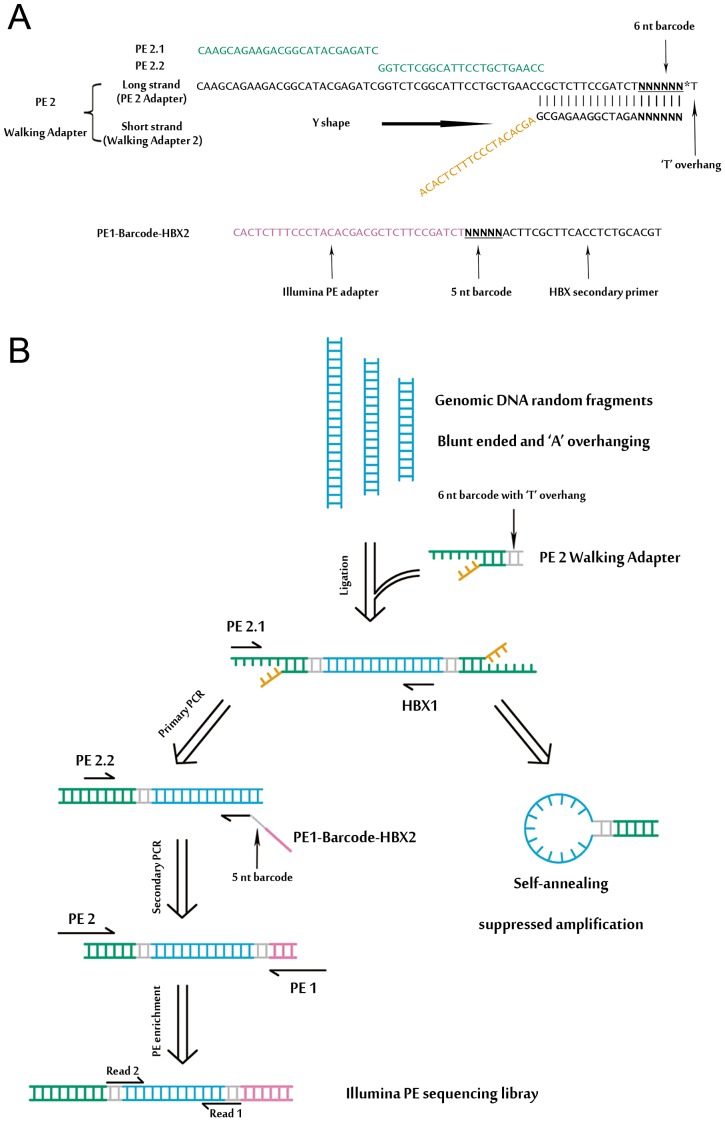
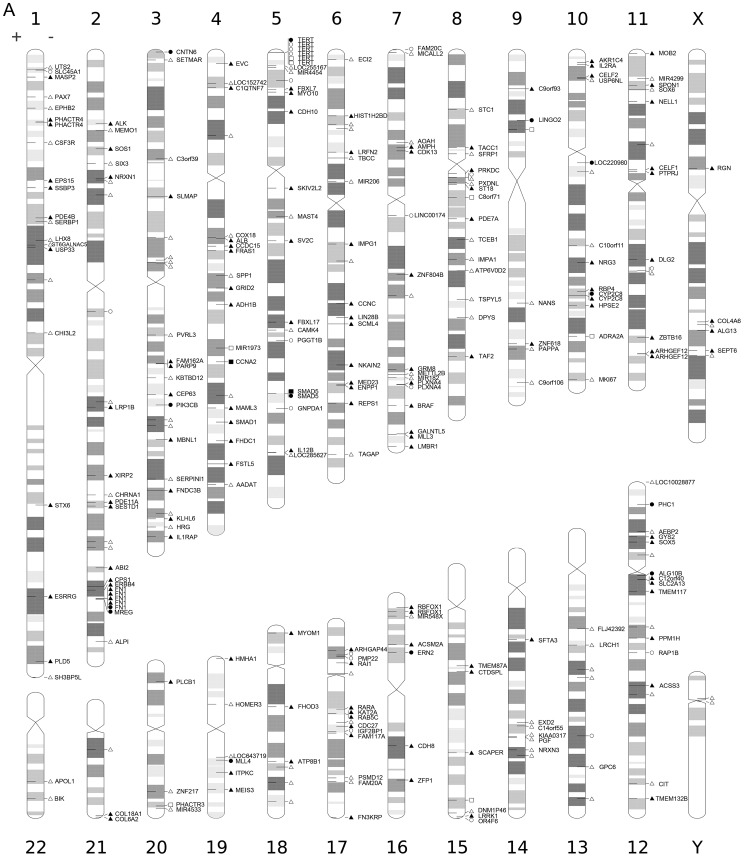
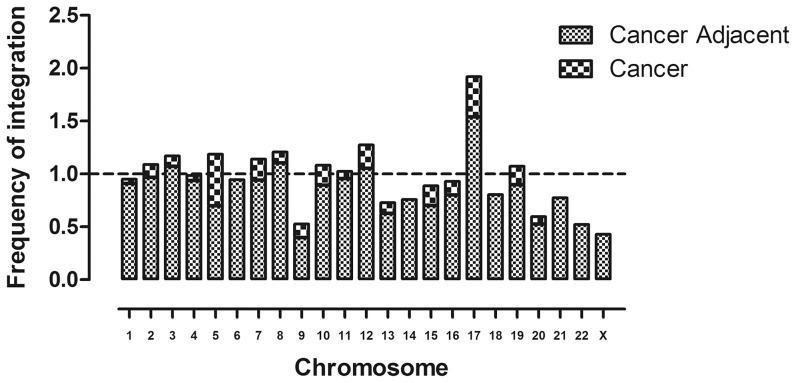
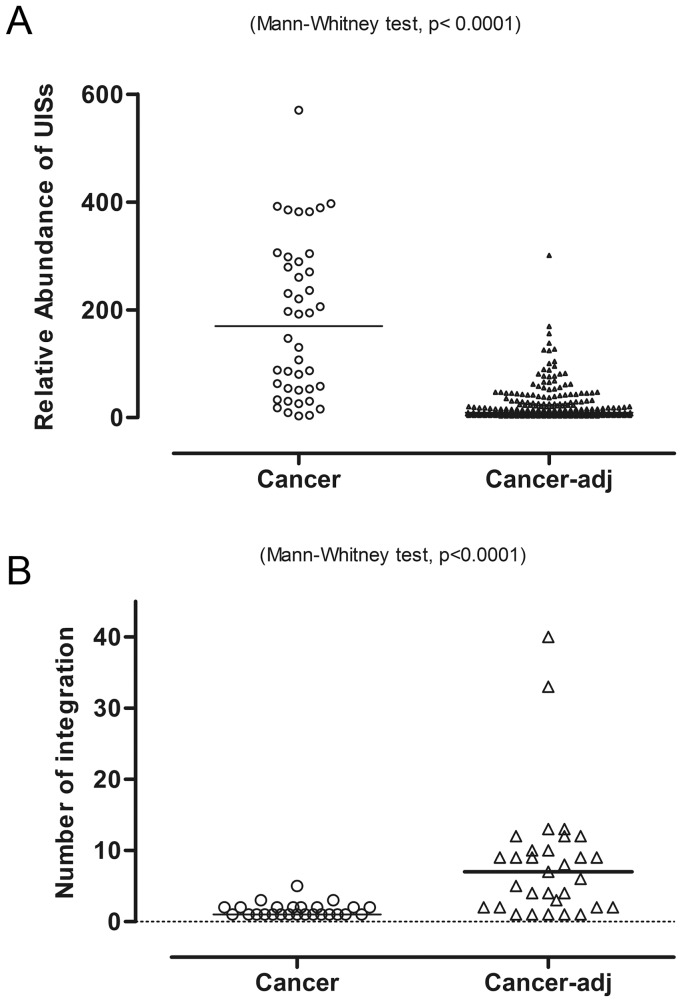
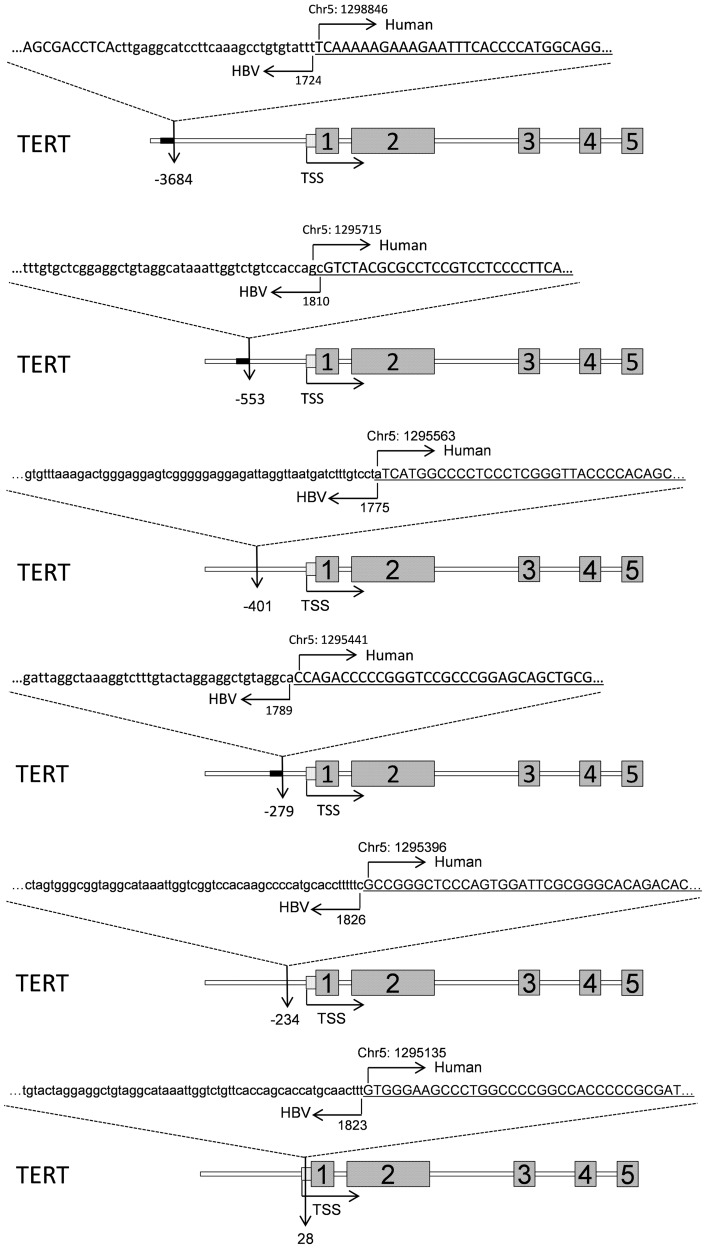
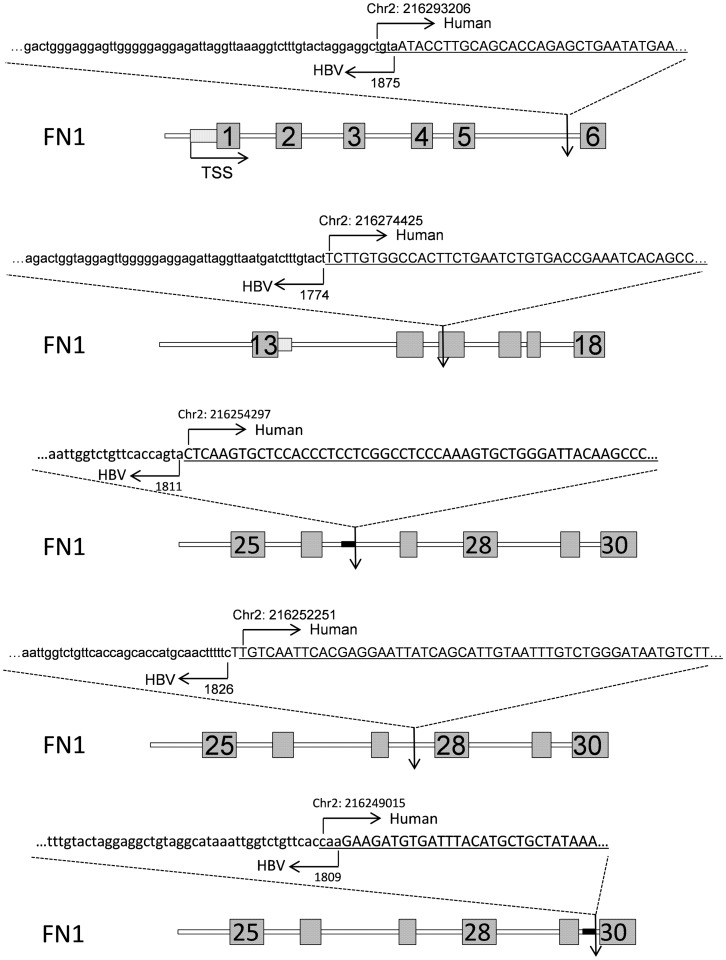
Integration of the viral DNA into host chromosomes was found in most of the hepatitis B virus (HBV)-related hepatocellular carcinomas (HCCs). Here we devised a massive anchored parallel sequencing (MAPS) method using next-generation sequencing to isolate and sequence HBV integrants. Applying MAPS to 40 pairs of HBV-related HCC tissues (cancer and adjacent tissues), we identified 296 HBV integration events corresponding to 286 unique integration sites (UISs) with precise HBV-Human DNA junctions. HBV integration favored chromosome 17 and preferentially integrated into human transcript units. HBV targeted genes were enriched in GO terms: cAMP metabolic processes, T cell differentiation and activation, TGF beta receptor pathway, ncRNA catabolic process, and dsRNA fragmentation and cellular response to dsRNA. The HBV targeted genes include 7 genes (PTPRJ, CNTN6, IL12B, MYOM1, FNDC3B, LRFN2, FN1) containing IPR003961 (Fibronectin, type III domain), 7 genes (NRG3, MASP2, NELL1, LRP1B, ADAM21, NRXN1, FN1) containing IPR013032 (EGF-like region, conserved site), and three genes (PDE7A, PDE4B, PDE11A) containing IPR002073 (3', 5'-cyclic-nucleotide phosphodiesterase). Enriched pathways include hsa04512 (ECM-receptor interaction), hsa04510 (Focal adhesion), and hsa04012 (ErbB signaling pathway). Fewer integration events were found in cancers compared to cancer-adjacent tissues, suggesting a clonal expansion model in HCC development. Finally, we identified 8 genes that were recurrent target genes by HBV integration including fibronectin 1 (FN1) and telomerase reverse transcriptase (TERT1), two known recurrent target genes, and additional novel target genes such as SMAD family member 5 (SMAD5), phosphatase and actin regulator 4 (PHACTR4), and RNA binding protein fox-1 homolog (C. elegans) 1 (RBFOX1). Integrating analysis with recently published whole-genome sequencing analysis, we identified 14 additional recurrent HBV target genes, greatly expanding the HBV recurrent target list. This global survey of HBV integration events, together with recently published whole-genome sequencing analyses, furthered our understanding of the HBV-related HCC.


Conflict of interest statement

Dong Ding is currently employed by Hangzhou Proprium Biotech. This research was support partially by funding from the HPB.

Figures

Figure 1
Figure 1. An overview of MAPS.
(A) Detailed illustration of the ‘Y’ shaped PE 2 Walking Adapter and the barcoded HBX nested primer. (B) Schematic of the MAPS approach. Adapters and primers are colored in accordance with (A). Detailed primer sequence information is provided in the Table S1, S2 and S3.
Figure 2
Figure 2. Interpretation of the results of MAPS.
(A). A representative mapping of the paired reads from MAPS at integration sites. Read 1 sequences are anchored, since they extend from the fixed HBX nested primer; while the positions of Read 2 sequences vary due to the random fragmentation. (B). Insertion sites illustration in UCSC genome browser. (i) Insertion in ERBB4. (ii) Insertion in GRM8. (C). Integrant sequences of ERBB4 and GRM8. Breakpoint is indicated by arrow. The numbers are HBV genome coordinates, based on the reference of GQ205441. The human gene sequences are underlined. Orange bases indicate the common base between HBV and Human at the junction. (D). Distribution of integrant lengths in the sequenced library of ERBB4 and GRM8 integrations.
Figure 3
Figure 3. Distribution of the identified UISs.
Locations of UISs in the human genome. Circles indicate the UISs found only in cancer tissue, triangles represent UISs only found in the adjacent tissue, and rectangles mean UISs found in both. The nearest gene in the vicinity of UIS was annotated, and the filled shapes marks UISs that integrate in the transcript unit.
Figure 4
Figure 4. Number of UISs per chromosome.
A frequency of 1 (represented by the dotted line) stands for the same level of integration as the random data, i.e., this chromosome is neither favored nor disfavored for HBV integration.
Figure 5
Figure 5. Quantitative feature of MAPS.
(A) Semi-quantitative PCR results in HCC DNA sample N13. Each panel represents different integration frequencies, judged by the number of unique tags identified by MAPS, as indicated by the number followed by the sample name on the left column labels. The amounts of genomic DNA used for PCR were indicated at the top of the lanes. (B) Semi-quantitative PCR results in multiplexed DNA samples. The left column indicates the HCC DNA sample identifications and the number of unique tags identified. (C) Correlation co-efficiency (R2 = 0.9278) of the numbers of unique tags covering the common insertions retrieved between two technical replicate runs. (D) Rarefaction analysis of integration sites recovered in MAPS.
Figure 6
Figure 6. More clonal expansion but fewer insertions were found in cancer than in the adjacent tissue.
(A) We counted the number of unique tags to quantify the relative abundance of each UIS. The bar is the median of the number of unique tags. (B) Number of HBV integrations identified in cancer and adjacent tissue. The bar represents the median of the number of integrations.
Figure 7
Figure 7. Illustration of the integrations targeted TERT.
The sequences were representative Read 2 tags that cover the HBV integration sites to the TERT gene. HBV DNA was shown in lowercase, and the Human DNA was in uppercase and underlined. The numbered boxes represent nearby exons. The nucleotide position at the human and HBV were also indicated (based on GenBank AY800389.1 and Human hg19 assemble).
Figure 8
Figure 8. Illustration of the integrations in FN1.
The sequences were representative Read 2 tags that cover the junction points of the HBV integration to the FN1 gene. HBV DNA was shown in lowercase, and the Human DNA was in uppercase and underlined. The numbered boxes represent nearby exons. The nucleotide position at the human and HBV were also indicated (based on GenBank AY800389.1 and Human hg19 assemble).

References

    1. Parkin DM (2006) The global health burden of infection-associated cancers in the year 2002. Int J Cancer 118: 3030–3044. - PubMed
    1. Szmuness W (1978) Hepatocellular carcinoma and the hepatitis B virus: evidence for a causal association. Prog Med Virol 24: 40–69. - PubMed
    1. Murakami Y, Saigo K, Takashima H, Minami M, Okanoue T, et al. (2005) Large scaled analysis of hepatitis B virus (HBV) DNA integration in HBV related hepatocellular carcinomas. Gut 54: 1162–1168. - PMC - PubMed
    1. Tokino T, Matsubara K (1991) Chromosomal sites for hepatitis B virus integration in human hepatocellular carcinoma. J Virol 65: 6761–6764. - PMC - PubMed
    1. Feitelson MA, Lee J (2007) Hepatitis B virus integration, fragile sites, and hepatocarcinogenesis. Cancer Lett 252: 157–170. - PubMed

Publication types

MeSH terms