. 2012;7(12):e50698.
doi: 10.1371/journal.pone.0050698. Epub 2012 Dec 7.

Anatomical brain images alone can accurately diagnose chronic neuropsychiatric illnesses

Affiliations

Anatomical brain images alone can accurately diagnose chronic neuropsychiatric illnesses

Ravi Bansal et al. PLoS One. 2012.

Abstract

Objective: Diagnoses using imaging-based measures alone offer the hope of improving the accuracy of clinical diagnosis, thereby reducing the costs associated with incorrect treatments. Previous attempts to use brain imaging for diagnosis, however, have had only limited success in diagnosing patients who are independent of the samples used to derive the diagnostic algorithms. We aimed to develop a classification algorithm that can accurately diagnose chronic, well-characterized neuropsychiatric illness in single individuals, given the availability of sufficiently precise delineations of brain regions across several neural systems in anatomical MR images of the brain.

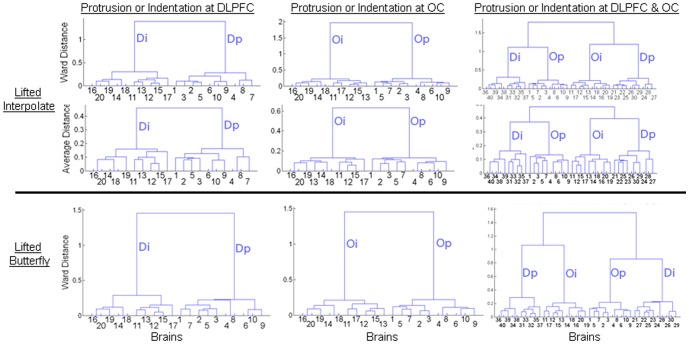
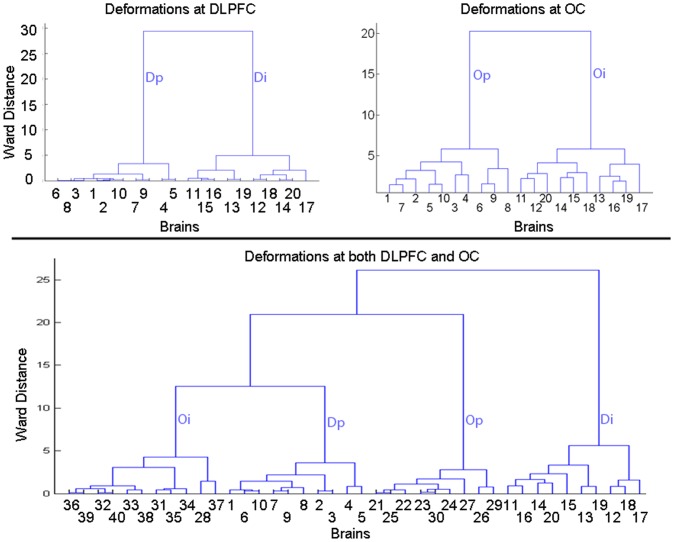
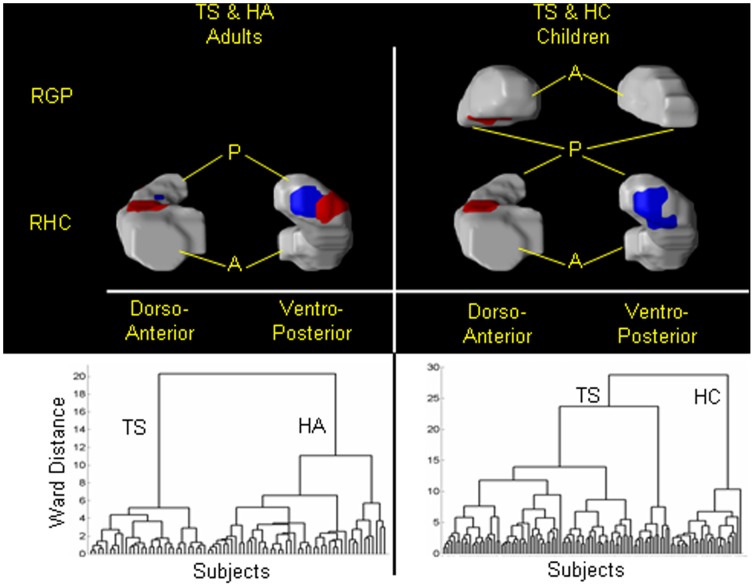
Methods: We have developed an automated method to diagnose individuals as having one of various neuropsychiatric illnesses using only anatomical MRI scans. The method employs a semi-supervised learning algorithm that discovers natural groupings of brains based on the spatial patterns of variation in the morphology of the cerebral cortex and other brain regions. We used split-half and leave-one-out cross-validation analyses in large MRI datasets to assess the reproducibility and diagnostic accuracy of those groupings.

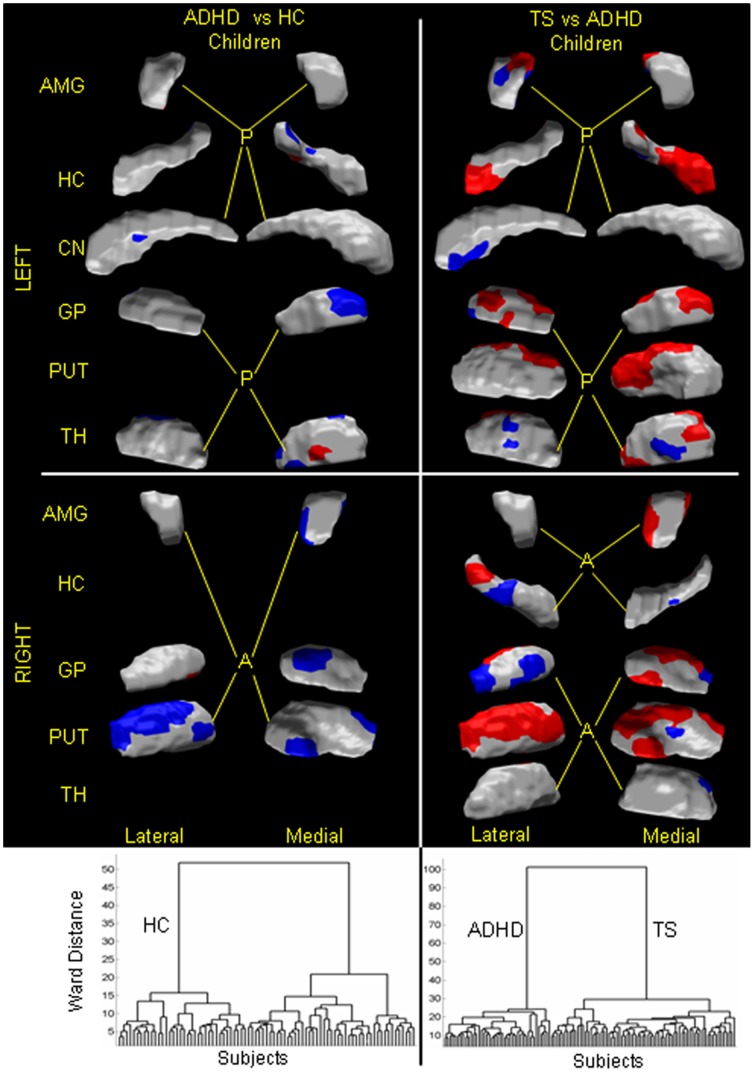
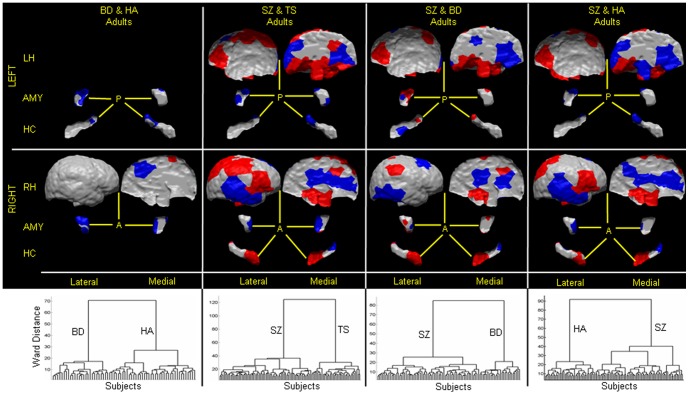
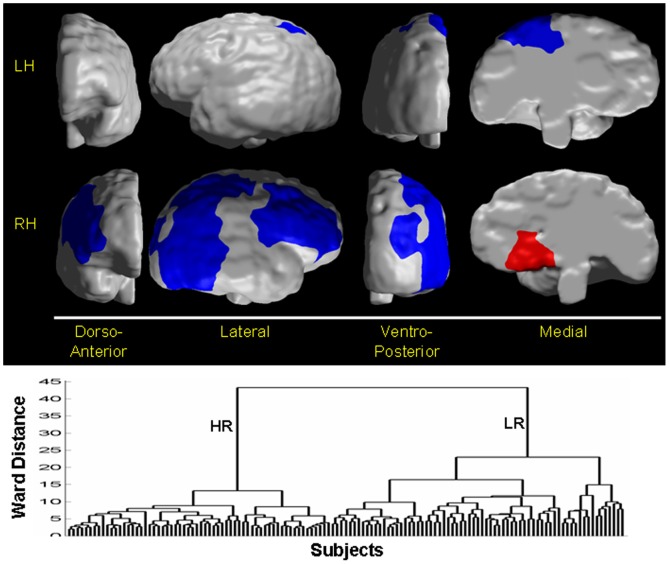
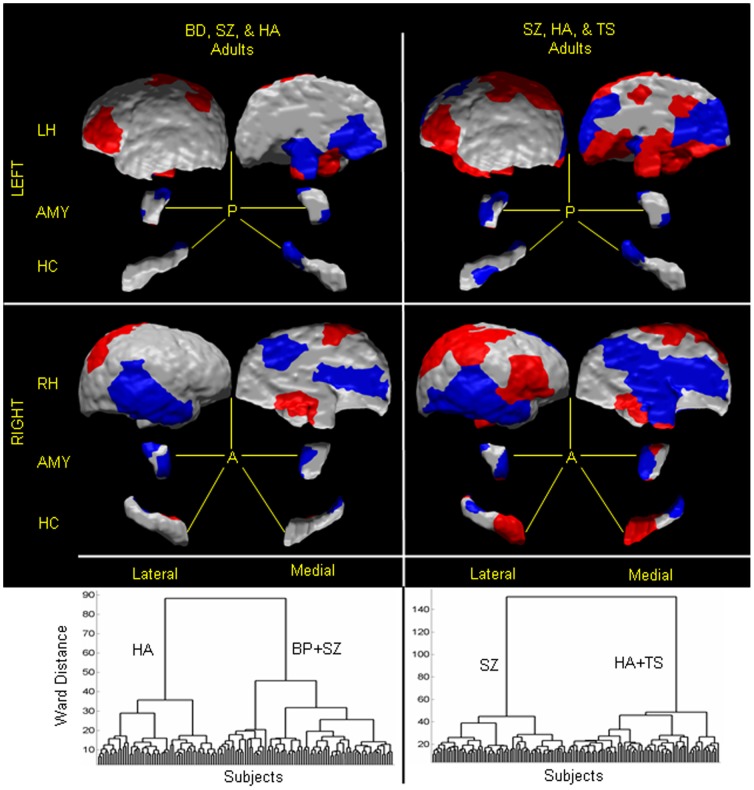
Results: In MRI datasets from persons with Attention-Deficit/Hyperactivity Disorder, Schizophrenia, Tourette Syndrome, Bipolar Disorder, or persons at high or low familial risk for Major Depressive Disorder, our method discriminated with high specificity and nearly perfect sensitivity the brains of persons who had one specific neuropsychiatric disorder from the brains of healthy participants and the brains of persons who had a different neuropsychiatric disorder.

Conclusions: Although the classification algorithm presupposes the availability of precisely delineated brain regions, our findings suggest that patterns of morphological variation across brain surfaces, extracted from MRI scans alone, can successfully diagnose the presence of chronic neuropsychiatric disorders. Extensions of these methods are likely to provide biomarkers that will aid in identifying biological subtypes of those disorders, predicting disease course, and individualizing treatments for a wide range of neuropsychiatric illnesses.


Conflict of interest statement

Competing Interests: The authors have declared that no competing interests exist.

Figures

Figure 1
Figure 1. Scaling coefficients at decreasing spatial resolutions.
The numbers of vertices in the triangulated mesh at each level of resolution are indicated at the bottom of the figure. The meshes with 12 and 162 vertices correspond to resolutions 0 and 2, respectively, of the spherical wavelet transformation. Top Row: Approximating a unit sphere at decreasing spatial resolutions. Middle and Bottom Row: Examples of scaling coefficients at decreasing resolutions for local variations in the surface morphological features of the right hippocampus in a representative healthy participant (NC) and a person with Schizophrenia (SZ). The scaling coefficients are color encoded and displayed at the vertices of sphere at the various resolutions. Protrusions with respect to a template surface are encoded in Red and Yellow, and indentations in the surface are encoded in Violet and Blue. Green indicates no difference in the surface. The scaling coefficients were computed by first using conformal mapping to map local variations in surface morphological features onto a unit sphere and then applying the lifted interpolate transformation to the mapped variations. At the lowest resolution, i.e. Resolution 0 of the wavelet transformation, scaling coefficients at the 12 vertices of the icosahedron very coarsely approximate the high-resolution variations in local morphological features. Using scaling coefficients at low spatial resolutions for classification greatly reduces the dimensionality of the feature space.
Figure 2
Figure 2. Warping a deformed brain to the template brain.
We added deformations to copies of the template brain and then normalized those deformed brains to the undeformed template. The deformed brains were spatially normalized using a method that maximizes mutual information in the gray scale values across the images and then warped the coregistered brain using a method based on fluid dynamics. Because a deformed brain was identical to the template brain except for the added deformation, the deformation field only shows a large spatial deformation in the region of the added deformation.
Figure 3
Figure 3. Deformations at the dorsolateral prefrontal cortex (DLPFC) in the template brain.
Top Row: In copies of the template brain we added a 15 mm wide protrusion or indentation in the DLPFC by centering the deformation over the midportion of the pars triangularis in the inferior frontal gyrus. We placed the deformed brains randomly in the coordinate space of the template brain. The deformed brains were coregistered to the template brain and then we computed the signed Euclidean distances between the surface of the coregistered brain and the surface of the template brain. The signed Euclidean distances were color-encoded and displayed on the template brain, and were mapped onto a unit sphere using a conformal mapping. Red: protrusion on the surface; Violet: indentations on the surface. Bottom Row: The distances on the unit sphere were transformed by applying spherical wavelet transformation to compute scaling coefficients at decreasing resolutions.
Figure 4
Figure 4. Optimal P-value threshold for scaling coefficients.
Naturalistic groupings of the brains were generated using scaling coefficients that differed significantly with at most a specified P-value between groups of participants in our cohort. The optimal P-value of the statistical significance was selected from the plots of sensitivity and specificity, and the number of scaling coefficients, for various P-value thresholds in our cohort of 42 healthy children (HC) and 71 children with Tourette's Syndrome (TS). The scaling coefficients were computed for the right and left amygdalae, hippocampi, global pallidus, putamina, caudate nuclei, thalami, and hemisphere surfaces. At each P-value threshold, we applied hierarchical clustering to all coefficients that differed with at most the specified P-value to generate groupings of the brains. These groupings were analyzed using leave-one-out (LOO) cross validation to compute the sensitivity and specificity of our method for classifying an individual as a healthy child or a child with TS. We independently computed sensitivity and specificities for various P-value thresholds and plotted the sensitivity (SE, solid line) and specificity (SP, dashed line) (Left), and the number of coefficients (Right), as a function of P-value thresholds. For a P-value threshold<10−7, the method classified an individual with both high sensitivity and high specificity. At this P-value threshold, moreover, the number of coefficients was sufficiently reduced, thereby reducing the dimensionality of the feature space. We therefore applied a P-value<10−7 as a threshold for classifying an individual among various neuropsychiatric illnesses. SE, sensitivity; SP, specificity.
Figure 5
Figure 5. Identifying natural groupings of identical brains containing differing known deformations.
Left Column: Brains 1 through 10 contained a protrusion, and brains 11 through 20 contained an indentation, in the DLPFC. Middle Column: Brains 1 through 10 contained a protrusion, and brains 11 through 20 contained an indentation, in the occipital cortex (OC). Right Column: Brains 1 through 10 had a protrusion at the OC, the brains 11 to 20 had an indentation at the OC whereas brains 21 through 30 contained a protrusion at the DLPFC and brains 31 through 40 had an indentation at the DLPFC. The deformed brains were normalized to the template to compute signed Euclidean distances. Those distances were mapped onto a sphere using a conformal mapping. We then applied either the lifted interpolate (top two rows) or the lifted butterfly (bottom row) to compute the scaling coefficients. Hierarchical clustering computed distances between features using either the average linkage or Ward's linkage. Left and middle dendrograms demonstrate that the brains were correctly clustered into two groups, one with indentations only and the other with protrusions only. Right dendrogram shows that the brains were correctly clustered into four groups: one with only protrusions in the OC, another with only protrusions in the DLPFC, another one with only indentations in the OC, and the last with only indentations in the DLPFC. Furthermore, Ward's distances between groups were larger than the average distances, indicating good separation of groups according to the type of synthetic deformation that was introduced into the data. Ward distances for feature vectors generated using lifted interpolate were generally greater than those generated using lifted butterfly, motivating our subsequent use of the lifted interpolate wavelet to compute scaling coefficients and use of Ward's linkage to cluster brains into naturalistic groups. Dp, protrusion in DLPFC; Di, indentation in DLPFC; Op, protrusion in OC; Oi, indentation in OC.
Figure 6
Figure 6. Identifying natural groupings of brains with known deformations from differing individuals.
Deformations were placed at either Dorsolateral Prefrontal Cortex (DLPFC) or Occipital Cortex (OC) in brain from 20 individuals. TopRow, Left: Brains 1 through 10 had protrusions and brains 11 through 20 had indentations at the DLPFC location. TopRow, Right: Brains 1 through 10 had protrusions and brains 11 through 20 had indentations at the OC location. The brains differed morphologically in addition to the added deformations. Variations in surface morphology from the template brain were analyzed by applying a method for spherical wavelet analysis to compute scaling coefficients at decreasing spatial resolution. The scaling coefficients were grouped by applying hierarchical clustering, which generated one group of brains with indentations only and another group of brains with protrusions only. TopLeft: Brains 1 through 10 had protrusions and brains 11 through 20 had indentations at the DLPFC location. Using the scaling coefficients at Resolution2 that differed significantly between these groups (P-value<10−7), the dendrogram shows that the brains were naturally clustered into two groups: one only with indentations, and the other only with protrusions. Top Right: Brains 1 through 10 had protrusions and brains 11 through 20 had indentations at the OC location. Using a different scaling coefficients at Resolution2 that differed significantly, the dendrogram shows that the data were naturally clustered into two groups: one only with indentations, and the other only with protrusions. Bottom: Brains 1 through 10 had protrusions, and brains 11 through 20 had indentations, at the DLPFC location. Brains 21 through 30 had protrusions, and brains 31 through 40 had indentations, at the OC location. Using scaling coefficients at Resolution2, the dendrogram shows that the data were naturally clustered into 4 groups: one only with indentations at the DLPFC, another only with protrusions at the DLPFC, another only with indentations at the OC, and the last only with protrusions at the OC. However, brain 28 with protrusion at the OC was grouped with brains that had indentations at the OC location. Dp; protrusion in DLPFC; Di; indentation in DLPFC; Op, protrusion in OC; Oi, indentation in OC.
Figure 7
Figure 7. Classifying a child as healthy or with ADHD, or as having either TS or ADHD.
In our cohort of 42 healthy children (HC), 41 ADHD children, and 71 children with TS, we first computed scaling coefficients for the left and right globus pallidus, putamina, caudate nuclei, thalami, amygdalae, and hippocampi. We then independently applied hierarchical clustering to those coefficients that differed significantly (P-value<10−7) between (1) ADHD children and HC, and (2) TS children and ADHD children. The left dendrogram suggested the presence of two groups: one (labeled as HC) consisted of 36 healthy children, and the other (labeled as ADHD children) consisted of the 41 ADHD children and 6 healthy children. The right dendrogram suggested that the brains were clustered into two distinct groups: one labeled TS only comprised of TS children and the other labeled ADHD only consisted of ADHD children. The adjusted misclassification rates ( Table 1 ) were: 11.5% for healthy children and 6.4% for ADHD children; and 0.17% for TS children and 0.5% ADHD children. Therefore, the sensitivity and specificity were: 93.6% and 89.5%, respectively, for classifying a child as an ADHD child; and 99.83% and 99.5%, respectively, for classifying a child as having either ADHD or TS. We plotted the patterns of surface features across the various brain regions that best classified a child. Left: The patterns that discriminated ADHD child from healthy child were localized to: lateral and posterior portions of the right putamen; anterior portions of the left and medial portion of the right globus pallidus; ventral portion of the left caudate; posterior and medial portions of the left thalamus; ventral portion of the left amygdala, and anterior and posterior portions of the right amygdala; and posterior portion of the left hippocampus. In red are regions with local protrusions, and in violet are regions with local indentations in ADHD children compared with the healthy children. Right: The pattern of surface features that discriminated between children with TS or ADHD included: anterior, lateral, and dorsal portions of the left globus pallidus, and dorsal, lateral, and medial portions of the right globus pallidus; ventral portion of the left caudate; dorso-medial portions of the left putamen, and lateral, dorsal, and medial portions of the right putamen; dorsal, posterior, and medial portions of the left thalamus, and posterior portion of the right thalamus; dorsal and posterior portions of the left amygdale, and anterior and posterior portions of the right amygdala; anterior and medial portions of the left hippocampus, and lateral portions of the right hippocampus. Regions in red are local protrusions, and regions in violet are local indentations, in TS children compared with ADHD children. GP, globus pallidus, CN, caudate nucleus; PUT, putamen; TH, thalamus; AMY, amygdala; HC, hippocampus; A: Anterior; P: Posterior.
Figure 8
Figure 8. Classifying an adult as healthy or with disorder, or between two neuropsychiatric illnesses.
In our cohort of 40 healthy adults (HA), 26 bipolar (BD) adults, 36 TS adults, and 65 adults with schizophrenia (SZ), we first computed scaling coefficients for the left and right hemispheres, amygdalae, and hippocampi. We then independently applied hierarchical clustering to those coefficients that differed significantly (P-value<10−7) between (1) BD adults and healthy adults (1st column), (2) SZ adults and TS adults (2nd column), (3) SZ adults and BD adults (3rd column), and (4) SZ adults and HA (4th column). The first dendrogram suggested the presence of two groups: one (labeled as HA) consisted of the 40 healthy adults, and the other (labeled as BD adults) consisted of the 26 BD adults. The second dendrogram demonstrated that the brains were clustered into two distinct groups: one containing only TS adults and the other only SZ adults. The third dendrogram also consisted of two distinct groups, one group only of BD adults and the other group only of SZ adults. The fourth dendrogram showed two groups of the brains, one labeled healthy adults consisted of healthy adults only, and the other labeled SZ consisted of all SZ adults and two healthy adults. The adjusted misclassification rates were (1) 3.6% for HA and 0% for BD adults, (2) 0% for both the TS and SZ adults, (3) 0% for both the BD and SZ adults, and (4) 6.9% for SZ adults and 5.5% for healthy adults. Therefore, the sensitivity and specificity were (1) 100% and 96.4%, respectively, for classifying a participant as a BD adult, (2) 100% for classifying an adult as TS or SZ adult, (3) 100% for classifying an adult as BD or SZ adult, and (4) 93.1% and 94.5%, respectively, for classifying a participant as SZ adult. We plotted the patterns of surface features across the various brain regions that best classified an adult. 1st Column These patterns were localized to: anterior and lateral regions of the left amygdala, and dorsal, lateral, and posterior regions of the right amygdala; posterior regions of the left hippocampus; and dorso-medial regions of the right hemisphere. In red are regions with local protrusions, and in violet are regions with local indentations in BD adults compared with the healthy adults. 2nd Column The pattern of surface features (Bottom) that discriminated between groups included: anterior and medial portions of the left amygdala, and lateral and posterior regions of the right amygdala; anterior and lateral aspects of the left hippocampus, and posterior portion of the right hippocampus; and dorsolateral prefrontal, parietal, and medial regions of the left hemisphere, and dorsolateral prefrontal, temporal, medial, and parietal regions of the right hemisphere. Regions in red are local protrusions, and regions in violet are local indentations, in SZ adults compared with TS adults. 3rd Column The pattern of surface features (Bottom) that discriminated between groups included: dorso-medial portions of the left amygdala, and ventro-medial regions of the right amygdala; posterior and lateral aspects of the left hippocampus, and anterior and posterior portion of the right hippocampus; medial dorso-lateral prefrontal, and parietal regions of the left hemisphere, and ventro-posterior, medial, and posterior lateral regions of the right hemisphere. Regions in red are local protrusions, and regions in violet are local indentations, in SZ adults compared with BD adults. 4th Column The surface features that best discriminated SZ adults from healthy adults were localized to: dorsolateral prefrontal cortex, superior parietal, and medial regions of the left hemisphere, and temporal, occipital, dorso-lateral, and medial regions of the right hemisphere; dorsal regions of left amygdala, and anterior regions of right amygdala; posterior regions of the left hippocampus, and anterior and posterior regions of the right hippocampus. In red are regions with local protrusions, and in violet are regions with local indentations in SZ adults compared with the healthy adults. LH, left hemisphere; RH, right hemisphere; AMY, amygdala; HC, hippocampus; A, anterior; P, posterior.
Figure 9
Figure 9. Classifying an individual as a healthy individual or an individual with Tourette Syndrome (TS).
In 42 healthy children (HC), 40 healthy adults (HA), 71 children with TS, and 36 adults with TS, we independently applied hierarchical clustering to scaling coefficients that differed significantly (P-value<10−7) between (1) adults with TS and healthy adults (left), and (2) children with TS and healthy children (right). The two largest groups in the right dendrogram were labeled HC (this group consisted of 27 healthy children) or TS children (which consisted of 71 TS and 15 healthy children); and those in the left dendrogram were labeled HA (40 healthy and 6 TS adults) or TS adults (30 TS adults). The adjusted misclassification rates were 5.4% and 21% for the TS children and HC, respectively, and 10% for HA and 16.8% for TS adults. Therefore, the sensitivity and specificity of the method were 94.6% and 79%, respectively, for classifying a child as either healthy child or as having TS, and were 83.2% and 90%, respectively, for classifying a participant as a TS adult. Left The dorso-anterior and ventro-posterior regions of the right hippocampus best classified a participant as either a healthy adult or TS adult. Regions in red are local protrusions, and regions in violet are local indentations, in TS adults compared with healthy adults. Right Shown here are the regions in right globus pallidus and right hippocampus where the scaling coefficients differed significantly between TS children and healthy children. The pattern of surface features that discriminated between the two groups included the dorso-anterior portions of the right globus pallidus, and the dorsal and ventro-posterior portion of the right hippocampus. Regions in red are local protrusions, and regions in violet are local indentations, in TS children compared with healthy children. RGP, Right Globus Pallidus; RHC, Right Hippocampus; A: anterior; P: posterior.
Figure 10
Figure 10. Classifying an individual as high or low familial risk for MDD.
In our cohort of 66 High Risk (HR) and 65 Low Risk (LR) participants, we applied hierarchical clustering using Ward's linkages to scaling coefficients computed at Resolution 2 from the local variations in cortical thickness across the right and the left hemispheres. Each group was assigned a diagnosis using the majority rule, such that a group was labeled HR if the majority of participants in that group belonged to a family with a grandparent who had MDD. Otherwise the group was labeled as LR. Assuming only two groups of participants, the adjusted misclassification rates were 29% for the LR participants and 19% for HR participants. Therefore, the sensitivity and the specificity for classifying an individual as HR were 81% and 71%, respectively. The pattern of cortical thickness that discriminated between the groups included superior regions of the left hemisphere and lateral surface of the right hemisphere. Regions in red are local thickening, and regions in violet are local thinning, in HR participants as compared with LR participants. The spatial pattern of variation in cortical thickness in the HR compared with the LR group is consistent with the pattern previously identified across risk groups in this sample. LH, left hemisphere; RH, right hemisphere.
Figure 11
Figure 11. Three-way classifications of an adult.
In our cohort of 40 healthy adults (HA), 26 BD adults, 65 SZ adults, and 36 TS adults, we applied hierarchical clustering to the scaling coefficients for the left and right amygdalae, hippocampi, and hemisphere surfaces that significantly differentiated between (1) both BD and SZ adults from HA (left), and (2) both TS and SZ adults from HA (right). The two largest groups in the left dendrogram were labeled HA (this group consisted of 40 HA) or BD+SZ adults (which consisted of 26 BD adults and 65 SZ adults). The groups in the right dendrogram were labeled HA+TS (which consisted of 40 HA and 35 TS adults) or SZ (which consisted of 65 SZ and 1 TS adults). Because the method performed poorly for these 3-way classifications of adults, we suggested an iterative two-step procedure for classification of these 3 groups. For classifying an individual as a healthy adult, an adult with BD, or an adult with SZ, first an individual was classified as belonging to one of two groups: (1) a healthy adult, or (2) a patient (i.e., as either an adult with BD or an adult with SZ). Our method classified adults between these two groups with 86% sensitivity and 100% specificity. Second, using a different set of scaling coefficients, the individual was classified as either an adult with BD or an adult with SZ with high sensitivity and specificity ( Fig. 2 ). Similarly, for classifying an individual as healthy adult, an adults with SZ or an adult with TS, an individual first was classified between two groups: (1) an adult with SZ, and (2) a healthy adult or an adult with TS. Our method classified an adult between these two groups with 99.99% sensitivity and 97.76% specificity. Second, using a different set of scaling coefficients, the individual was classified as either an adult with TS or a healthy adult ( Fig. 3 ). Left The pattern of the surface features that best classified an individual as either a healthy adult or a patient (i.e. as either an adults with BD or an adult with SZ) in the first 2-way classification included: smaller anterior and dorsal portions of the left amygdala, and smaller anterior and lateral portions of the right amygdala; smaller posterior regions of the left hippocampus, and smaller posterior portions of the right hippocampus; larger dorsolateral prefrontal, smaller ventro-medial, and larger parietal portions of the left hemisphere, and larger superior-parietal, larger superior-occipital, smaller temporal, and smaller medial portions of the right hemisphere. Regions in red are local protrusions, and regions in violet are local indentations, in BD adults or SZ adults compared with healthy adults. Right The pattern of the surface features that best classified an individual into one of the two groups (either as an adult with SZ, or as a healthy adult or adult with TS) included: anterior and lateral regions of the left and right amygdalae; posterior and lateral regions of the left hippocampus, and anterior and posterior regions of the right hippocampus; anterior, ventral, posterior, medial, and superior regions of the left hemisphere, and medial and lateral regions of the right hemisphere. Regions in red are local protrusions, and regions in violet are local indentations, in SZ adults compared with healthy adults or adults with TS. LH, left hemisphere; RH, right hemisphere; AMY, amygdala; HC, hippocampus; A, anterior; P, posterior.

References

    1. Peterson BS (2010) Form Determines Function: New Methods for Identifying the Neuroanatomical Loci of Circuit-Based Disturbances in Childhood Disorders. Journal of the American Academy of Child and Adolescent Psychiatry 49: 533–535. - PMC - PubMed
    1. Peterson BS, Choi HA, Hao X, Amat J, Zhu H, et al. (2007) Morphology of the Amygdala and Hippocampus in Children and Adults with Tourette Syndrome. Archives General Psychiatry - PMC - PubMed
    1. Peterson BS, Warner V, Bansal R, Zhu H, Hao X, et al. (2009) Cortical thinning in persons at increased familial risk for major depression. Proc Natl Acad Sci USA 106: 6273–6278. - PMC - PubMed
    1. Toga AW, Thompson PA (2003) Mapping brain asymmetry. Nature Neuroscience 4: 37–48. - PubMed
    1. Luders E, Narr K, Thompson P, Woods R, Rex D, et al. (2005) Mapping cortical gray matter in the young adult brain: E®ects of gender. NeuroImage 26: 493–501. - PubMed

Publication types

MeSH terms