

Two distinct chronic obstructive pulmonary disease (COPD) phenotypes are associated with high risk of mortality
- PMID: 23236428
- PMCID: PMC3517611
- DOI: 10.1371/journal.pone.0051048
Two distinct chronic obstructive pulmonary disease (COPD) phenotypes are associated with high risk of mortality
Abstract
Rationale: In COPD patients, mortality risk is influenced by age, severity of respiratory disease, and comorbidities. With an unbiased statistical approach we sought to identify clusters of COPD patients and to examine their mortality risk.
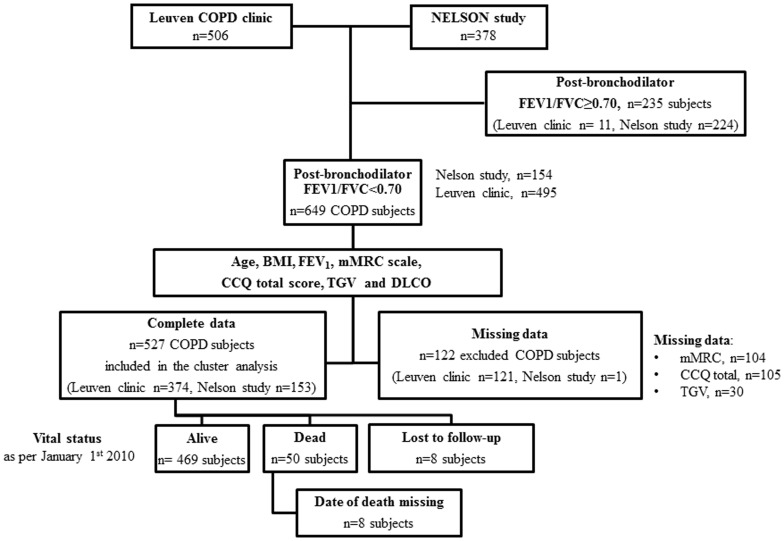
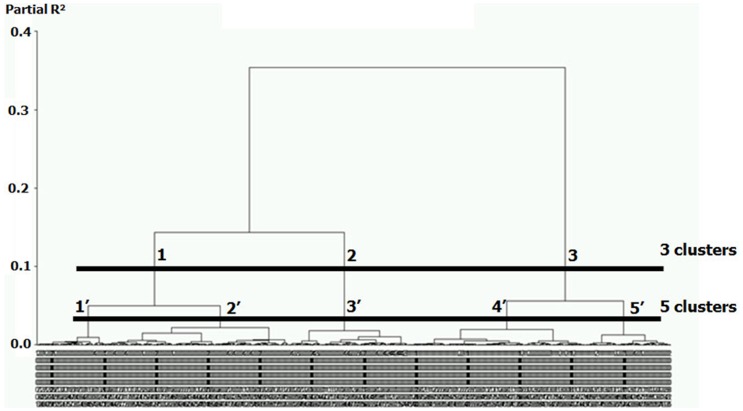
Methods: Stable COPD subjects (n = 527) were classified using hierarchical cluster analysis of clinical, functional and imaging data. The relevance of this classification was validated using prospective follow-up of mortality.
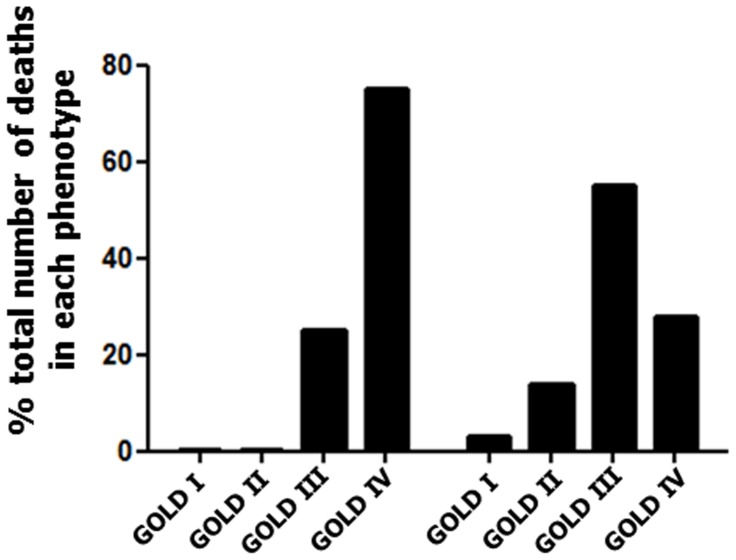
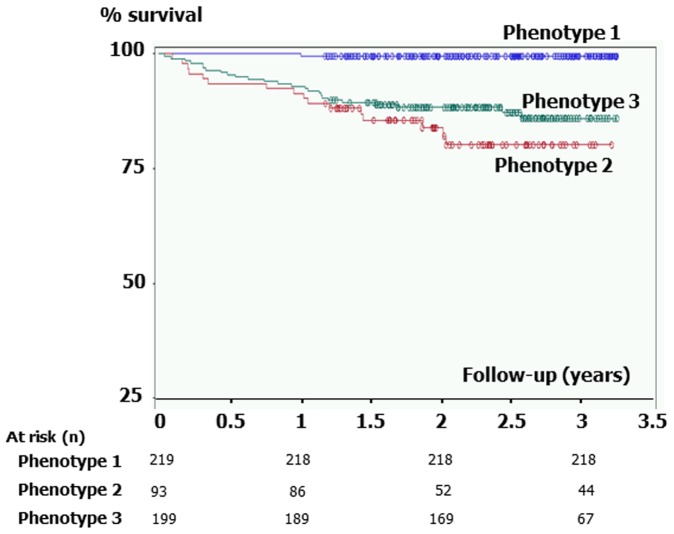
Results: The most relevant patient classification was that based on three clusters (phenotypes). Phenotype 1 included subjects at very low risk of mortality, who had mild respiratory disease and low rates of comorbidities. Phenotype 2 and 3 were at high risk of mortality. Phenotype 2 included younger subjects with severe airflow limitation, emphysema and hyperinflation, low body mass index, and low rates of cardiovascular comorbidities. Phenotype 3 included older subjects with less severe respiratory disease, but higher rates of obesity and cardiovascular comorbidities. Mortality was associated with the severity of airflow limitation in Phenotype 2 but not in Phenotype 3 subjects, and subjects in Phenotype 2 died at younger age.
Conclusions: We identified three COPD phenotypes, including two phenotypes with high risk of mortality. Subjects within these phenotypes may require different therapeutic interventions to improve their outcome.
Conflict of interest statement
Figures
References
-
- Rabe KF, Hurd S, Anzueto A, Barnes PJ, Buist SA, et al. (2007) Global strategy for the diagnosis, management, and prevention of chronic obstructive pulmonary disease: GOLD executive summary. Am J Respir Crit Care Med 176: 532–555. - PubMed
-
- Sin DD, Anthonisen NR, Soriano JB, Agusti AG (2006) Mortality in COPD: role of comorbidities. Eur Resp J 28: 1245–1257. - PubMed
-
- Dolan S, Varkey B (2005) Prognostic factors in chronic obstructive pulmonary disease. Curr Opin Pulm Med 11: 149–152. - PubMed
-
- Agusti A, Celli B (2011) Avoiding confusion in COPD: from risk factors to phenotypes to measures of disease characterisation. Eur Resp J 38: 749–751. - PubMed
Publication types
MeSH terms
LinkOut - more resources
Full Text Sources
Medical
