Comparative Study
. 2012;7(12):e51357.
doi: 10.1371/journal.pone.0051357. Epub 2012 Dec 7.

Methionine-restricted C57BL/6J mice are resistant to diet-induced obesity and insulin resistance but have low bone density

Affiliations
Comparative Study

Methionine-restricted C57BL/6J mice are resistant to diet-induced obesity and insulin resistance but have low bone density

Gene P Ables et al. PLoS One. 2012.

Erratum in

  • PLoS One. 2014;9(7):e104050

Abstract

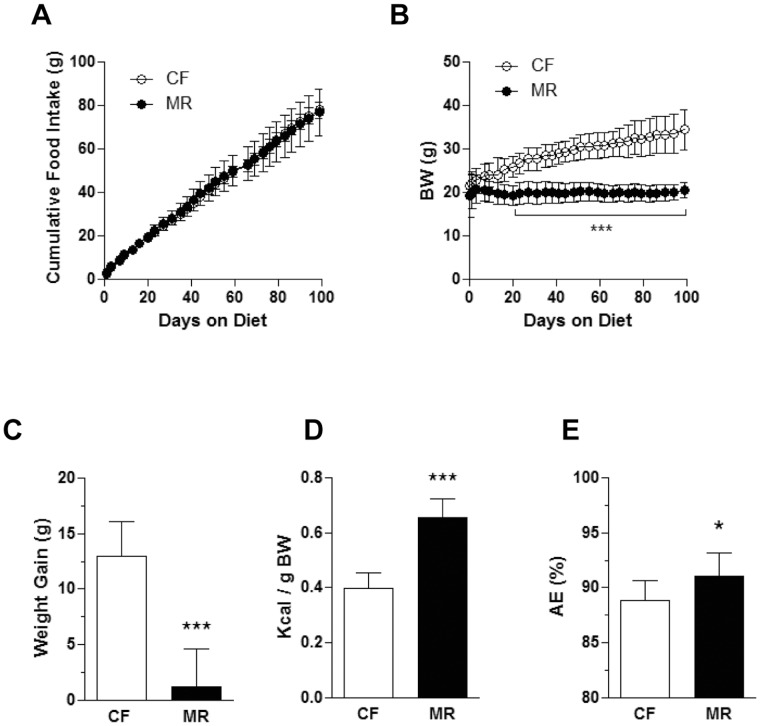
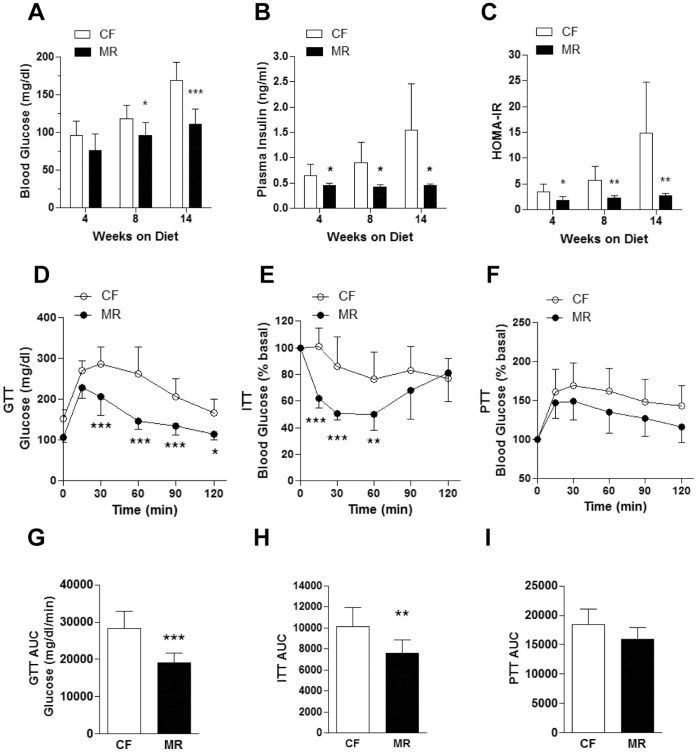
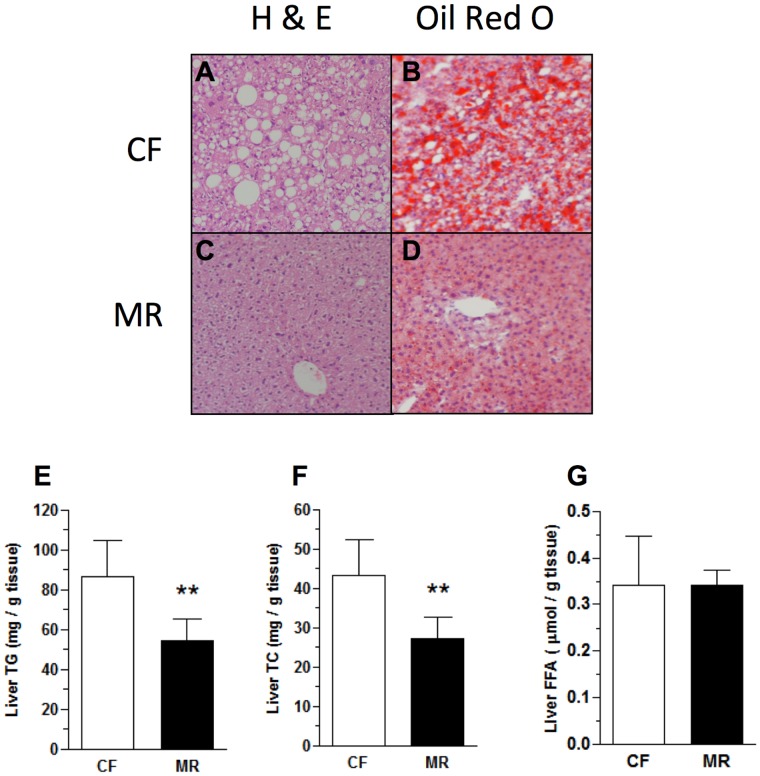
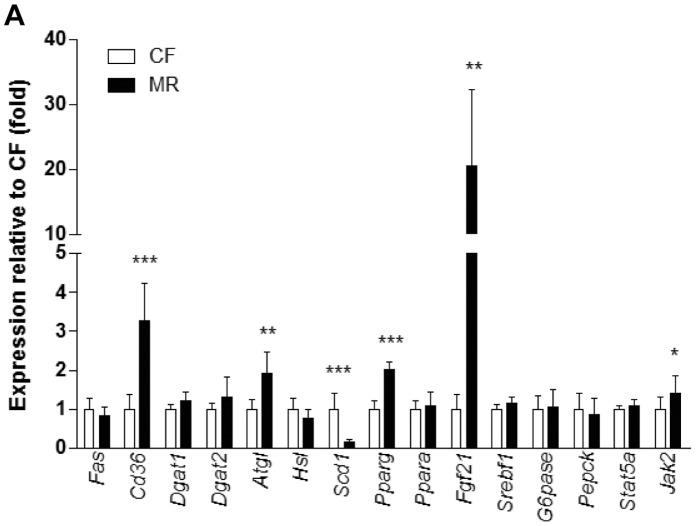
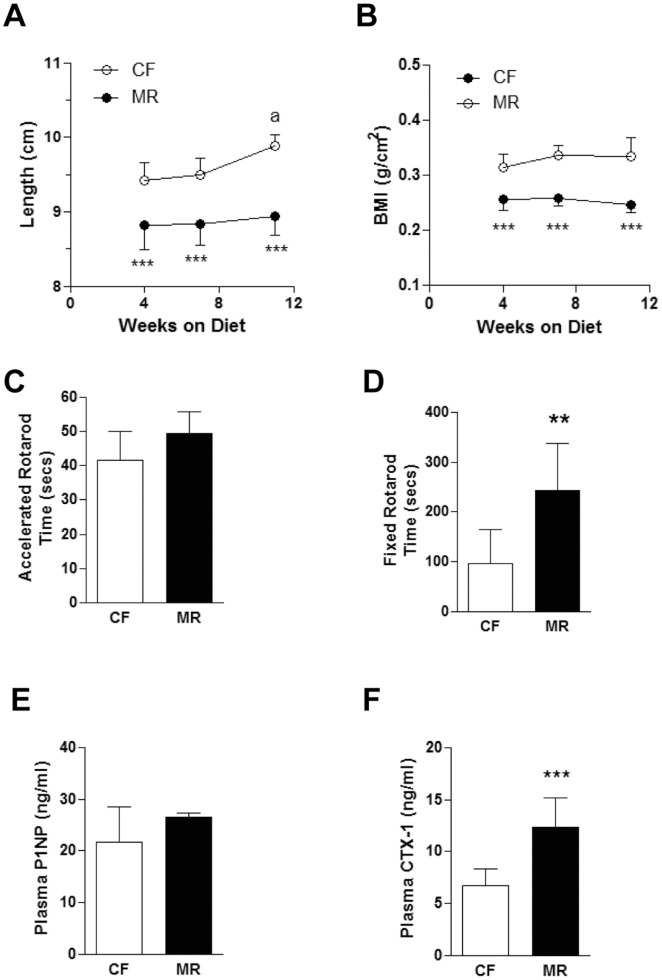
Dietary methionine restriction (MR) extends lifespan, an effect associated with reduction of body weight gain, and improvement of insulin sensitivity in mice and rats as a result of metabolic adaptations in liver, adipose tissue and skeletal muscle. To test whether MR confers resistance to adiposity and insulin resistance, C57BL/6J mice were fed a high fat diet (HFD) containing either 0.86% methionine (control fed; CF) or 0.12% methionine (methionine-restricted; MR). MR mice on HFD had lower body weight gain despite increased food intake and absorption efficiency compared to their CF counterparts. MR mice on HFD were more glucose tolerant and insulin sensitive with reduced accumulation of hepatic triglycerides. In plasma, MR mice on HFD had higher levels of adiponectin and FGF21 while leptin and IGF-1 levels were reduced. Hepatic gene expression showed the downregulation of Scd1 while Pparg, Atgl, Cd36, Jak2 and Fgf21 were upregulated in MR mice on HFD. Restriction of growth rate in MR mice on HFD was also associated with lower bone mass and increased plasma levels of the collagen degradation marker C-terminal telopeptide of type 1 collagen (CTX-1). It is concluded that MR mice on HFD are metabolically healthy compared to CF mice on HFD but have decreased bone mass. These effects could be associated with the observed increase in FGF21 levels.


Conflict of interest statement

Competing Interests: The authors have declared that no competing interests exist.

Figures

Figure 1
Figure 1. MR mice on HFD have lower body weight gain despite increased energy intake.
(A) Cumulative food intake was measured on HFD mice twice a week for 99 days. (B) Body weights (BW) were measured on HFD mice twice a week for 99 days. (C) Body weight gain was the difference between the weights at the beginning and at the end of the study. (D) Energy intake was calculated based on the average daily energy (kcal) intake per gram body weight. (E) Absorption efficiency was estimated based on the amount of food intake and fecal output within a 24 h period as described in the Methods section. Data is presented as the mean ± SD of 8 mice per treatment group and analyzed by Two-way ANOVA followed by Bonferroni post-tests (A and B) or Student’s unpaired t-test (C–E). *p<0.05, ***p<0.001.
Figure 2
Figure 2. MR mice on HFD have improved glucose homeostasis.
(A) Six hour fasting blood glucose was measured from a tail snip of each mouse using a handheld glucometer. (B) Fasting plasma insulin levels were measured using an ELISA kit as described in the Methods section. (C) Homeostasis model for insulin resistance (HOMA-IR) from HFD mice was calculated as described in the Methods section. (D) Intraperitoneal glucose tolerance test (GTT) was conducted on HFD mice after 8 weeks on the experimental diets. (E) Intraperitoneal insulin tolerance test (ITT) was conducted on HFD mice after 10 weeks on the diets. (F) Intraperitoneal pyruvate tolerance test (PTT) was conducted on HFD mice after 12 weeks on the diets. Areas under the curve (AUC) of GTT (G), ITT (H) and PTT (I). Data is presented as the mean ± SD of 8 mice per treatment group and analyzed by Two-way ANOVA followed by Bonferroni post-tests (D–F) or Student’s unpaired t-test (A–C and G–I). *p<0.05, **p<0.01, ***p<0.001.
Figure 3
Figure 3. MR mice on HFD did not develop hepatic steatosis.
H & E staining of liver sections from CF (A) and MR (C) mice on HFD. Oil red O staining of liver sections from CF (B) and MR (D) mice on HFD. Sections for both stains were at 5 µm and were photographed at ×100 magnification. (E) Liver TG levels from HFD mice. (F) Liver TC levels from HFD mice. (G) Liver FFA levels from HFD mice. All data are expressed as the mean ± SD (n = 7–8 mice per feeding group) and analyzed by Student’s unpaired t-test. *p<0.05, ***p<0.001.
Figure 4
Figure 4. Hepatic gene expression of MR mice on HFD corresponded with improved insulin sensitivity.
(A) Hepatic gene expression analysis by Taqman qPCR using β-actin as the housekeeping gene. All data are expressed as the mean ± SD (n = 7–8 mice per feeding group) and analyzed by Student’s unpaired t-test. *p<0.05, ***p<0.001.
Figure 5
Figure 5. MR mice on HFD were shorter and had lower bone mass.
(A) Mouse measurements from the tip of the nose to the base of the tail. (B) Mouse body mass indexes (BMI) based on the calculations mentioned in the Methods section. Statistical analysis used was One-way ANOVA followed by Bonferroni post-tests where ***p<0.001 is for CF vs MR at all time points and ap<0.01 is the comparison between CF measurements at 11 and 4 weeks. (C) Accelerated rotarod experiments were conducted as described in the Methods section. (D) Fixed rotarod experiments were conducted as described in the Methods section. (E) Plasma N-terminal propeptide of type 1 procollagen (P1NP) as determined by ELISA. F. Plasma C-terminal telopeptide of type 1 collagen (CTX-1) as determined by ELISA. Data are expressed as the mean ± SD (n = 7–8 mice per feeding group) and Figs. C–F were analyzed by Student’s unpaired t-test. *p<0.05, **p<0.01, ***p<0.001.

Similar articles

Cited by

References

    1. Kahn BB, Flier JS (2000) Obesity and insulin resistance. J Clin Invest 106: 473–481. 10.1172/JCI10842 [doi]. - PMC - PubMed
    1. Winzell MS, Ahren B (2004) The high-fat diet-fed mouse: a model for studying mechanisms and treatment of impaired glucose tolerance and type 2 diabetes. Diabetes 53 Suppl 3: S215–S219. 53/suppl_3/S215 [pii]. - PubMed
    1. Lin S, Thomas TC, Storlien LH, Huang XF (2000) Development of high fat diet-induced obesity and leptin resistance in C57Bl/6J mice. Int J Obes Relat Metab Disord 24: 639–646. - PubMed
    1. Koteish A, Diehl AM (2001) Animal models of steatosis. Semin Liver Dis 21: 89–104. - PubMed
    1. Malloy VL, Krajcik RA, Bailey SJ, Hristopoulos G, Plummer JD, et al... (2006) Methionine restriction decreases visceral fat mass and preserves insulin action in aging male Fischer 344 rats independent of energy restriction. Aging Cell 5: 305–314. ACE220 [pii];10.1111/j.1474-9726.2006.00220.x [doi]. - PubMed

Publication types

MeSH terms