. 2012;7(12):e51371.
doi: 10.1371/journal.pone.0051371. Epub 2012 Dec 7.

Col1A1 production and apoptotic resistance in TGF-β1-induced epithelial-to-mesenchymal transition-like phenotype of 603B cells

Affiliations

Col1A1 production and apoptotic resistance in TGF-β1-induced epithelial-to-mesenchymal transition-like phenotype of 603B cells

Jun Liu et al. PLoS One. 2012.

Abstract

Recent studies have suggested that proliferating cholangiocytes have an important role in the induction of fibrosis, either directly via epithelial-to-mesenchymal transition (EMT), or indirectly via activation of other liver cell types. Transforming growth factor beta 1 (TGF-β1), a critical fibrotic cytokine for hepatic fibrosis, is a potent EMT inducer. This study aimed to clarify the potential contributions of TGF-β1-induced EMT-like cholangiocyte phenotype to collagen production and cell survival of cholangiocytes in vitro. Mouse cholangiocytes (603B cells) were treated with TGF-β1 and EMT-like phenotype alterations were monitored by morphological changes and expression of EMT-associated genes. Alterations in Col1A1 gene, Col1A1-associated miR-29s, and pro-apoptotic genes were measured in TGF-β1-treated 603B cells. Snail1 knockdown was achieved using shRNA to evaluate the contribution of EMT-associated changes to Col1A1 production and cell survival. We found TGF-β1 treatment induced partial EMT-like phenotype transition in 603B cells in a Snail1-dependent manner. TGF-β1 also stimulated collagen α1(I) expression in 603B cells. However, this induction was not parallel to the EMT-like alterations and independent of Snail1 or miR-29 expression. Cells undergoing EMT-like changes showed a modest down-regulation of multiple pro-apoptotic genes and displayed resistance to TNF-α-induced apoptosis. TGF-β1-induced apoptosis resistance was attenuated in Snail1 knockdown 603B cells. TGF-β1-induced Col1A1 production seems to be independent of EMT-like transition and miR-29 expression. Nevertheless, TGF-β1-induced EMT may contribute to the increased survival capacity of cholangiocytes via modulating the expression of pro-apoptotic genes.


Conflict of interest statement

Competing Interests: The authors have declared that no competing interests exist.

Figures

Figure 1
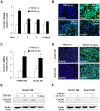
Figure 1. TGF-β1 induces EMT-associated changes in 603B cells.
(A) Morphological alterations of 603B cells induced by TGF-β1 (3 ng/ml) at indicated time points. Upper panel are representative phase images showing the 603B cells cultured in the absence of TGF-β1 and lower panel shows the 603B cells stimulated with TGF-β1. After TGF-β1 exposure, 603B cells gradually assumed a spindle-like shape. (B) Alterations of E-cadherin and N-cadherin mRNA expression in 603B cells after exposure to TGF-β1 for various periods of time as assessed by qRT-PCR. TGF-β1 treatment induced steady down-regulation of E-cadherin and up-regulation of N-cadherin. The qRT-PCR results shown represent an average of three independent experiments. (C) Cellular levels of E-cadherin and N-cadherin proteins in TGF-β1-treated 603B cells as determined by Western blot. Consistent with qRT-PCR analysis, TGF-β1 induced down-regulation of E-cadherin and up-regulation of N-cadherin, respectively. Representative blots from three independent experiments are shown and actin was blotted to ensure equal loading. Densitometric levels of E-cadherin and N-cadherin signals were quantified and expressed as the ratio to actin. (D) Decreased cell membrane distribution of E-cadherin protein in 603B cells in respond to TGF-β1 stimulation as assessed by immunofluorescent staining. E-cadherin was stained green and DAPI stained nuclei blue. (E) α-SMA and Fn-1 mRNA expression levels were determined by qRT-PCR and (F) FSP-1 and vimentin protein expression levels were determined by Western blot. No significant change of these genes was detected. Values are means ± SE. *p<0.05 compared to non-TGF-β1-treated cells; E-cad = E-cadherin; N-cad = N-cadherin. Bar = 10 µM.
Figure 2
Figure 2. Snail1 knockdown attenuates TGF-β1-induced EMT-associated changes in 603B cells.
(A) qRT-PCR revealed the rapid up-regulation of Snail1 mRNA levels in 603B cells after TGF-β1 (3 ng/ml) treatment. Data represent an average of three independent experiments. (B) Snail1 shRNA but not control shRNA abolished the upregulation of Snail1 mRNA levels by TGF-β1 in 603B cells. Cells stably expressing the Snail1 shRNA or control shRNA were exposed to TGF-β1 (3 ng/ml) for 1.5 h and expression of Snail1 mRNA levels were determined by qRT-PCR. (C) Snail1 shRNA decreases Snail1 protein expression in 603B cells. Cells stably expressing the Snail1 shRNA or control shRNA were exposed to TGF-β1 (3 ng/ml) for 6 h and expression of Snail1 protein levels were determined by Western blot. (D) Morphological changes of 603B cells stably expressing control shRNA or Snail1 shRNA after TGF-β1 (3 ng/ml) treatment for 6 days. (E) and (F) Effects of Snail1 knockdown on E-cadherin and N-cadherin expression in 603B cells following TGF-β1 treatment. Cells stably expressing the control shRNA or Snail1 shRNA were treated with TGF-β1 (3 g/ml) for 6 days and expression of E-cadherin and N-cadherin were determined by qRT-PCR (E) and Western blot (F), respectively. Values are means ± SE. *p<0.05 compared to non-TGF-β1-treated cells; # p<0.05 compared to cells expressing the shRNA-NS after TGF-β1 treatment; E-cad = E-cadherin; N-cad = N-cadherin; shRNA-NS = non specific shRNA control; Snail1-KD = snail shRNA knockdown. Bar = 10 µM.
Figure 3
Figure 3. TGF-β1-induced Col1A1 expression is independent of Snail1 up-regulation.
TGF-β1 (3 ng/ml) treatment transiently increased Col1A1 mRNA and protein in 603B cells, as determined by qRT-PCR (A and C), immunofluorescent staining (B and D) and Western blot (E and F). Snail1 knockdown did not affect TGF-β1-induced up-regulation of Col1A1 in 603B cells (C–F). Cells stably expressing the Snail1 shRNA or control shRNA were exposed to TGF-β1 (3 ng/ml) for 24 h (for qRT-PCR of Col1A1 in C) and for 2 days (for Conl1A1 protein staining in D and Western blot in E and F). The qRT-PCR results shown represent an average of three independent experiments. Values are means ± SE. *p<0.05 compared to non-TGF-β1-treated cells; shRNA-NS = non specific shRNA control; Snail1-KD = snail shRNA knockdown; Bar = 10 µM.
Figure 4
Figure 4. TGF-β1-induced Col1A1 expression is independent of miR-29 downregulation.
(A) The schematic of Col1A1 mRNA showed three potential binding sites in its 3′UTR for miR-29 targeting. (B) Col1A1 3'UTR fragments containing miR-29 potential binding sites results in translational suppression in 603B cells as assessed by luciferase reporter assay. The Col1A1 3'UTR sequence covering the potential binding sites for miR-29 was inserted into the pMIR-REPORT luciferase plasmid. The empty pMIR-REPORT luciferase plasmid was used as the control. 603B cells were transfected with the constructs and luciferase analysis was performed 48 h later. Values are means ± SE. *p<0.05 compared to cells transfected with the empty pMIR-REPORT luciferase vector. (C) qRT-PCR analysis revealed no significant down-regulation of miR-29 family members in 603B cells following TGF-β1 treatment for up to 6 days. Data represent an average of three independent experiments.
Figure 5
Figure 5. Snail1 is required for TGF-β1-induced apoptosis resistance in 603B cells.
(A) TGF-β1 pretreatment inhibits TNF-α- and SC-514-induced cell death. Cells were culture in the absence or presence of TGF-β1 for 5 days and then treated with TNF-α plus SC-514 for additional 24 h. Apoptosis-associated nuclear decomposition in TGF-β1-pretrated or non-pretreated 603B cells as assessed by PI staining. Insets are higher magnifications of the boxed region. Bar = 10 µM. (B) Quantification of frequency of TNF-α/SC-514-induced cell death by trypan blue. Data are presented as percentage of total cell numbers. (C) The PARP cleavage assay for assessing apoptosis by flow cytometry. 603B cells were treated as described above. Both free-floating and attached cells were collected and stained with FITC-conjugated antibody against cleaved PARP followed by FACS analysis. (D) TGF-β1 pretreatment inhibits TNF-α- and SC-514-induced cleavage of caspase-3 in 603B cells. 603B cells were exposed to TGF-β1 for 1 and 5 days, followed by TNF-α plus SC-514 treatment for additional 24 h. The activation of caspase-3 was assessed by Western blot using antibody recognizing both the full-length caspase-3 and cleaved caspase-3 forms. (E) Snai1 is required for the inhibitory effects of TGF-β1 pretreatment on TNF-α- and SC-514-induced cleavage of caspase-3 in 603B cells. 603B stably cells expressing control shRNA or Snail1 shRNA were stimulated with TGF-β1 for 5 days, followed by TNF-α plus SC-514 treatment for 24 h. The activation of caspase-3 was assessed by Western blot. Representative blots in D and E are from three independent experiments and actin was blotted to ensure equal loading. Values are means ± SE. *p<0.05 compared to non- TNF-α/SC514 treated cells; # p<0.05 compared to non-TGF-β1 pretreated cells. shRNA-NS = non specific shRNA control; Snail1-KD = snail shRNA knockdown.
Figure 6
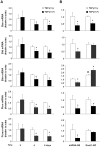
Figure 6. Snail1 contributes to the down-regulation of pro-apoptotic genes induced by TGF-β1.
(A) 603B cells were treated with TGF-β1 for indicated periods of time. Alterations of mRNA expression for pro-apoptotic genes Pten, Bim, Bax, Bid and Puma were assessed by qRT-PCR. (B) 603B cells stably expressing control shRNA or Snail1 shRNA were treated with TGF-β1 for 6 days. Changes of pro-apoptotic gene mRNA levels were determined by qRT-PCR. Data represent an average of three independent experiments. Values are means ± SE. *p<0.05 compared to non-TGF-β1 treated cells; # p<0.05 compared to shRNA-NS control. shRNA-NS = non specific shRNA control; Snail1-KD = snail shRNA knockdown.

Similar articles

Cited by

References

    1. Bataller R, Brenner DA (2005) Liver fibrosis. J Clin Invest 115: 209–218. - PMC - PubMed
    1. Friedman SL (2008) Mechanisms of hepatic fibrogenesis. Gastroenterology. 134: 1655–1669. - PMC - PubMed
    1. Beaussier M, Wendum D, Schiffer E, Dumont S, Rey C, et al. (2007) Prominent contribution of portal mesenchymal cells to liver fibrosis in ischemic and obstructive cholestatic injuries. Lab Invest 87: 292–303. - PubMed
    1. Wells RG (2008) Cellular sources of extracellular matrix in hepatic fibrosis. Clin Liver Dis 12: 759–768. - PMC - PubMed
    1. Priester S, Wise C, Glaser SS (2010) Involvement of cholangiocyte proliferation in biliary fibrosis. World J Gastrointest Pathophysiol 1: 30–37. - PMC - PubMed

Publication types

MeSH terms