. 2012;6(12):e1957.
doi: 10.1371/journal.pntd.0001957. Epub 2012 Dec 6.

Can human movements explain heterogeneous propagation of dengue fever in Cambodia?

Affiliations

Can human movements explain heterogeneous propagation of dengue fever in Cambodia?

Magali Teurlai et al. PLoS Negl Trop Dis. 2012.

Abstract

Background: Determining the factors underlying the long-range spatial spread of infectious diseases is a key issue regarding their control. Dengue is the most important arboviral disease worldwide and a major public health problem in tropical areas. However the determinants shaping its dynamics at a national scale remain poorly understood. Here we describe the spatial-temporal pattern of propagation of annual epidemics in Cambodia and discuss the role that human movements play in the observed pattern.

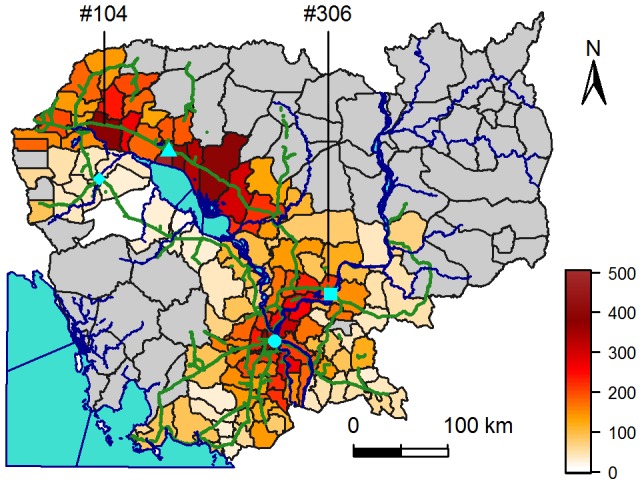
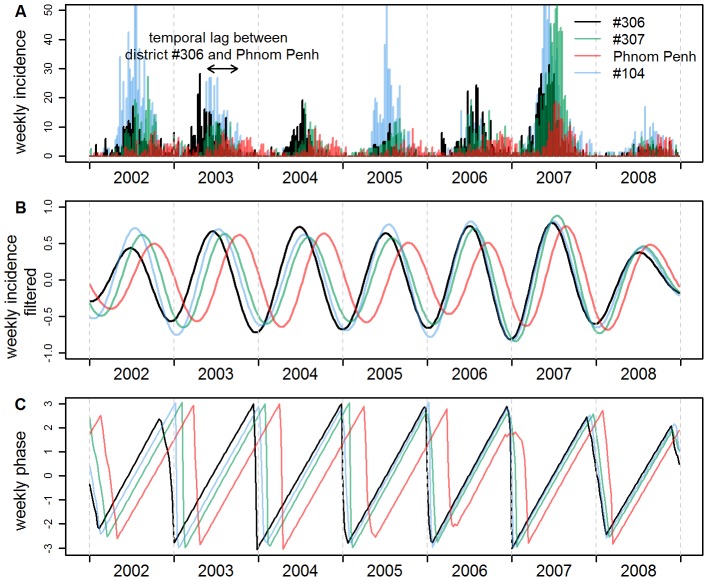
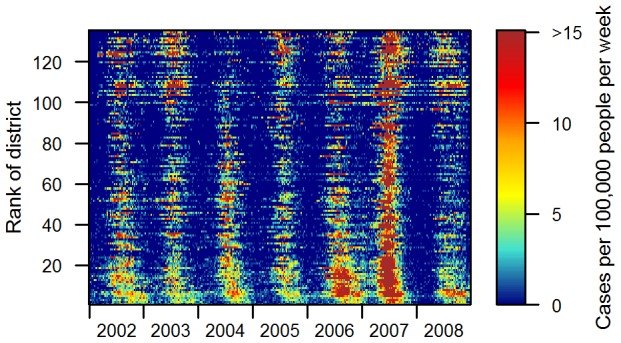
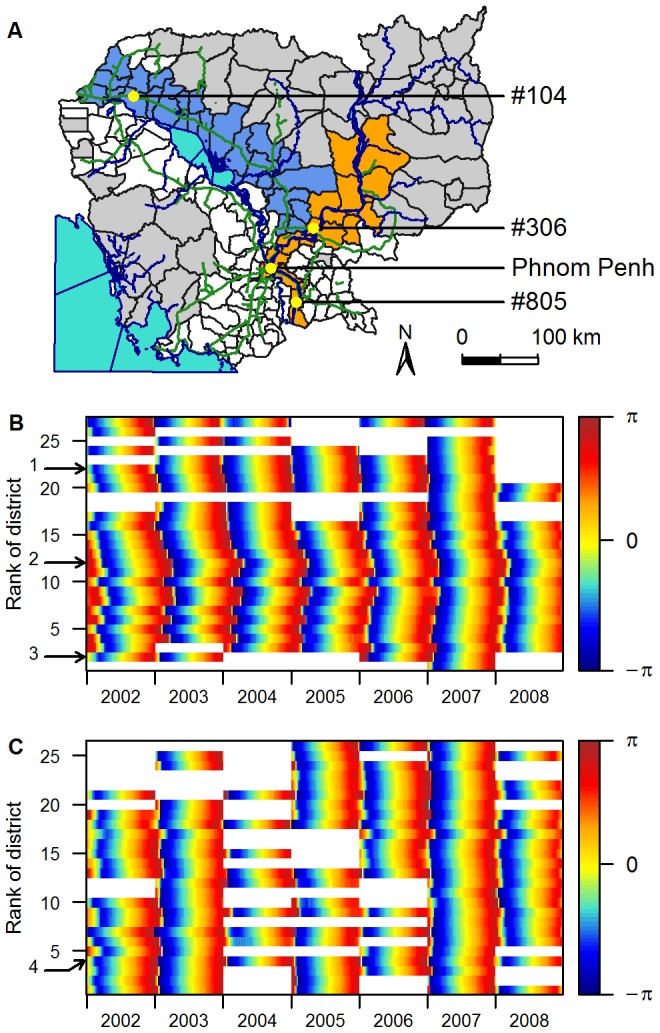
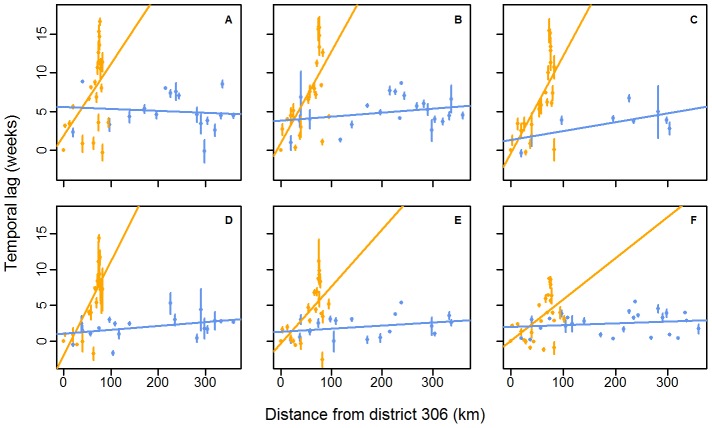
Methods and findings: We used wavelet phase analysis to analyse time-series data of 105,598 hospitalized cases reported between 2002 and 2008 in the 135 (/180) most populous districts in Cambodia. We reveal spatial heterogeneity in the propagation of the annual epidemic. Each year, epidemics are highly synchronous over a large geographic area along the busiest national road of the country whereas travelling waves emanate from a few rural areas and move slowly along the Mekong River at a speed of ~11 km per week (95% confidence interval 3-18 km per week) towards the capital, Phnom Penh.

Conclusions: We suggest human movements - using roads as a surrogate - play a major role in the spread of dengue fever at a national scale. These findings constitute a new starting point in the understanding of the processes driving dengue spread.


Conflict of interest statement

The authors have declared that no competing interests exist.

Figures

Figure 1
Figure 1. Map of mean annual dengue fever incidence rates in districts of Cambodia.
Mean annual incidence rates (in number of cases declared per 100,000 people per year) are calculated over 2002 to 2008, for districts with more than 20 people per km2. Cambodia is surrounded by the Indian Ocean (bottom left), Thailand (West), Lao (North) and Vietnam (East and South-East). Phnom Penh, the capital, is represented by a circle, Siem Reap by a triangle, Kampong Cham by a square and Battambang by a lozenge. Blue lines represent the Mekong River, going north to south, and the Tonle Sap River linking the Tonle Sap central Lake to the Mekong River. Green lines represent national roads. Grey districts have less than 20 people per km2.
Figure 2
Figure 2. Weekly raw incidence rates, filtered incidence and phase of four districts in Cambodia.
The four districts are: district #306 (black), a rural district located around Kampong Cham; Phnom Penh (red); District #307 (green), a rural district located mid-way between #306 and Phnom Penh; District #104 (blue). (A) Weekly raw incidence rates (in number of cases declared per 100,000 people per week). (B) Annual component of incidence, obtained by filtering raw weekly incidence in the 0.8–1.2 year periodic band using wavelet analysis. (C) Phase of the annual component of incidence, computed in the 0.8–1.2 periodic band using wavelet analysis (see Methods).
Figure 3
Figure 3. Apparent dengue haemorrhagic fever weekly incidence rates in the 135 most populous districts of Cambodia.
Weekly incidence rates (cases per 100,000 people per week) were computed in each of the 135 districts where population density is higher than 20 people per km2 in Cambodia. Districts are ranked by increasing distance to Phnom Penh from bottom to top.
Figure 4
Figure 4. Phases of the annual component of incidence for districts located along two geographic axes.
Phases are computed in the 0.8–1.2 year periodic band. (A) Map of the two geographic areas chosen: the national road in blue, and the Mekong River in orange. (B) Phase of districts along the Mekong River (orange in Figure 4A), presented from the most southerly to the most northerly from bottom to top. (C) Phase of districts along the national road (blue in Figure 4A), presented from West to East from bottom to top. The arrows indicate districts: 1, #306; 2, Phnom Penh; 3, #805 (Figure 4B); 4, #104 (Figure 4C).
Figure 5
Figure 5. Scatterplot of mean annual temporal lags between epidemics against distances between districts.
Temporal lags between epidemics and distances are computed relative to district #306. The lines show the linear regressions between the mean annual temporal lag of the annual epidemic in each district and the distance for 2002 (A), 2003 (B), 2004 (C), 2005 (D), 2006 (E) and 2007 (F). Colours represent the geographic localisation of each district, according to Figure 4A. The number of districts included in the analysis changes every year, according to whether an epidemic occurred in the district (Table 1). Error bars represent the 95% C.I. associated with the mean. Normality and homoscedasticity of residuals were confirmed using the Shapiro-Wilks and the Bartlett tests respectively (alpha level of 0.05).

References

    1. Wearing HJ, Rohani P (2006) Ecological and immunological determinants of dengue epidemics. Proc Natl Acad Sci U S A 103: 11802–11807. - PMC - PubMed
    1. Huy R, Buchy P, Conan A, Ngan C, Ong S, et al. (2010) National dengue surveillance in Cambodia 1980–2008: epidemiological and virological trends and the impact of vector control. Bull World Health Organ doi:10.2471/BLT.09.073908. - DOI - PMC - PubMed
    1. Hay SI, Myers MF, Burke DS, Vaughn DW, Endy T, et al. (2000) Etiology of interepidemic periods of mosquito-borne disease. Proc Natl Acad Sci U S A 97: 9335–9339. - PMC - PubMed
    1. Mammen MP Jr, Pimgate C, Koenraadt CJM, Rothman AL, Aldstadt J, et al. (2008) Spatial and temporal clustering of dengue virus transmission in Thai villages. PLoS Med doi:10.1371/journal.pmed.0050205. - DOI - PMC - PubMed
    1. Harrington LC, Scott TW, Lerdthusnee K, Coleman RC, Costero A, et al. (2005) Dispersal of the dengue vector Aedes aegypti within and between rural communities. Am J Trop Med Hyg 72: 209–220. - PubMed

Publication types