. 2012 Dec 13:10:165.
doi: 10.1186/1741-7015-10-165.

Real-time numerical forecast of global epidemic spreading: case study of 2009 A/H1N1pdm

Affiliations

Real-time numerical forecast of global epidemic spreading: case study of 2009 A/H1N1pdm

Michele Tizzoni et al. BMC Med. .

Abstract

Background: Mathematical and computational models for infectious diseases are increasingly used to support public-health decisions; however, their reliability is currently under debate. Real-time forecasts of epidemic spread using data-driven models have been hindered by the technical challenges posed by parameter estimation and validation. Data gathered for the 2009 H1N1 influenza crisis represent an unprecedented opportunity to validate real-time model predictions and define the main success criteria for different approaches.

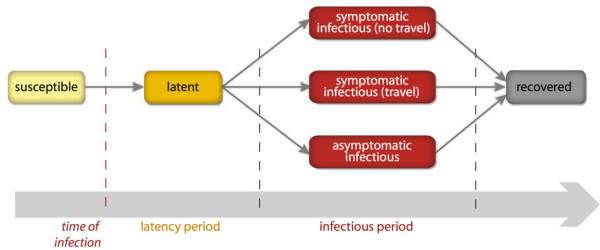
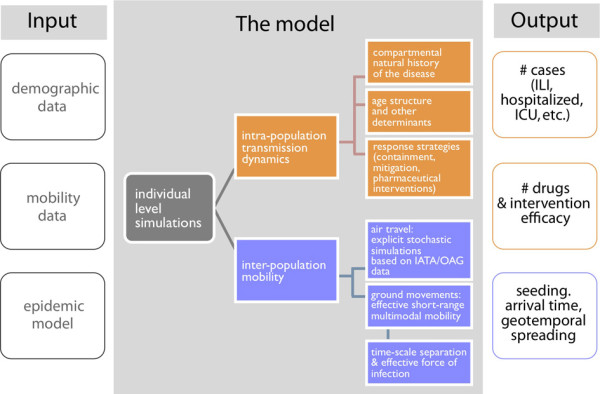
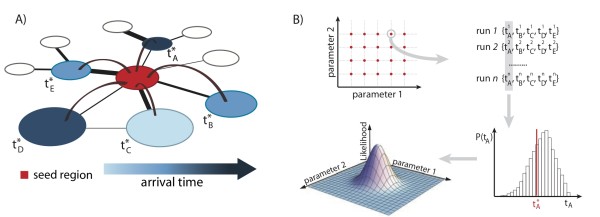
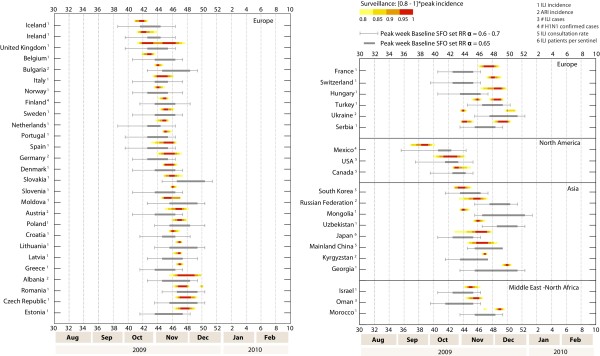
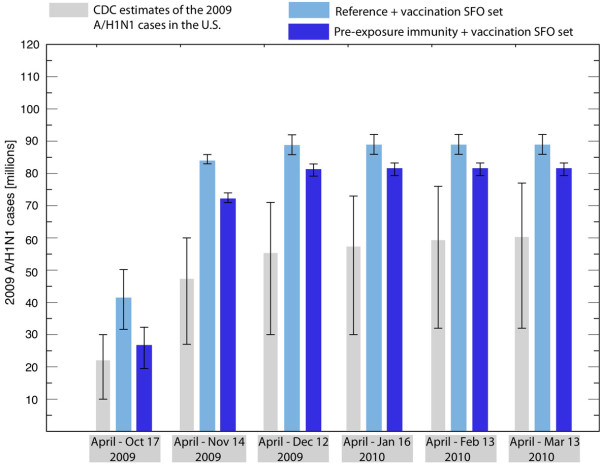
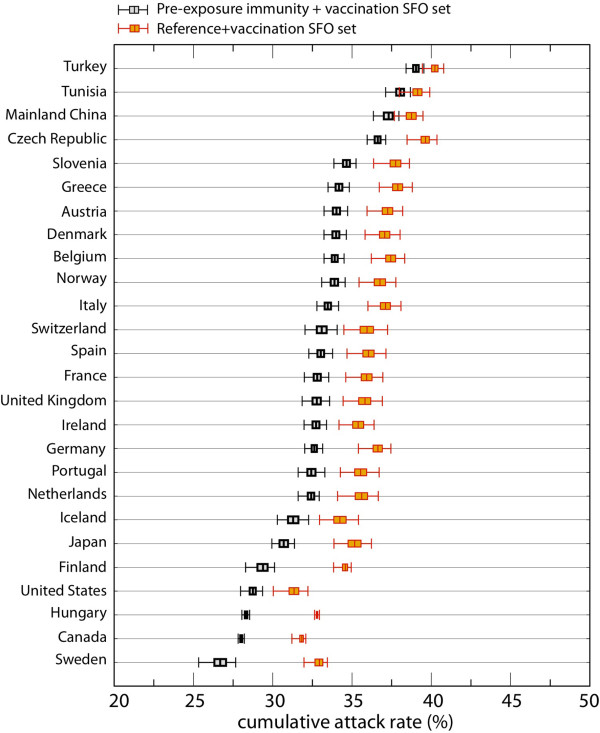
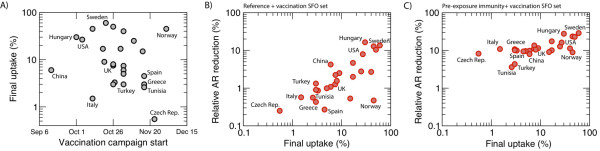
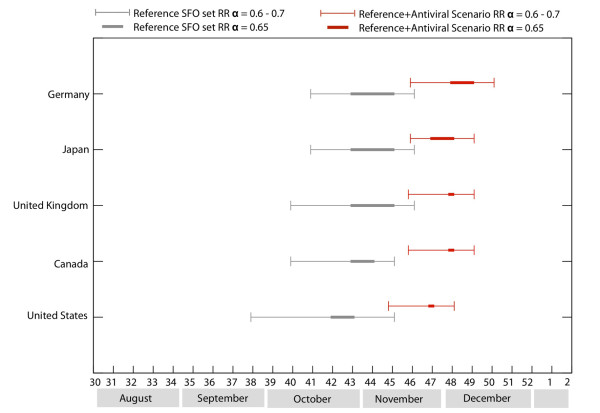
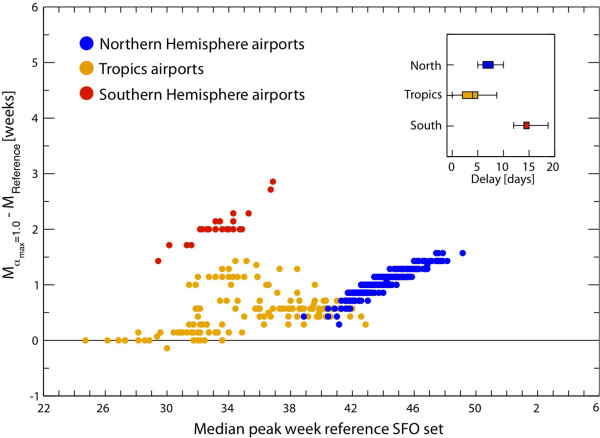
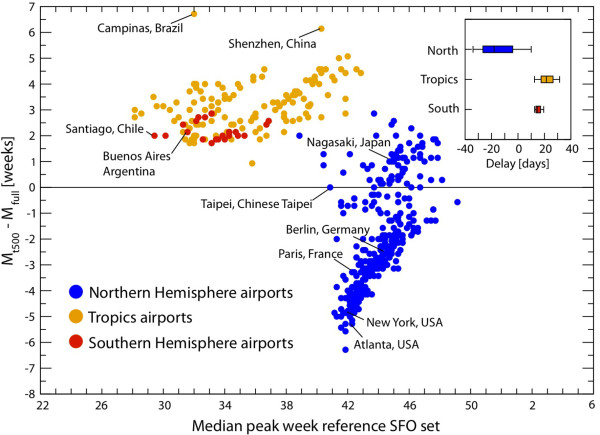
Methods: We used the Global Epidemic and Mobility Model to generate stochastic simulations of epidemic spread worldwide, yielding (among other measures) the incidence and seeding events at a daily resolution for 3,362 subpopulations in 220 countries. Using a Monte Carlo Maximum Likelihood analysis, the model provided an estimate of the seasonal transmission potential during the early phase of the H1N1 pandemic and generated ensemble forecasts for the activity peaks in the northern hemisphere in the fall/winter wave. These results were validated against the real-life surveillance data collected in 48 countries, and their robustness assessed by focusing on 1) the peak timing of the pandemic; 2) the level of spatial resolution allowed by the model; and 3) the clinical attack rate and the effectiveness of the vaccine. In addition, we studied the effect of data incompleteness on the prediction reliability.

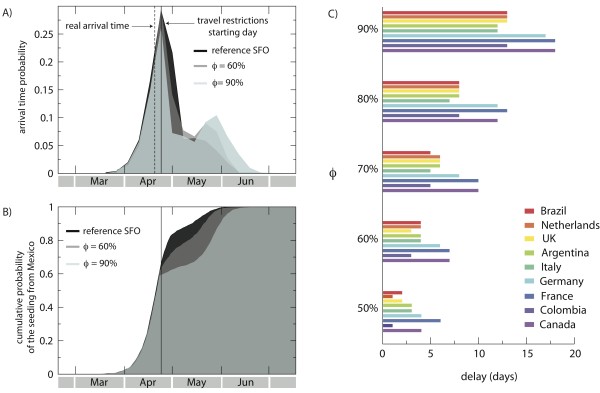
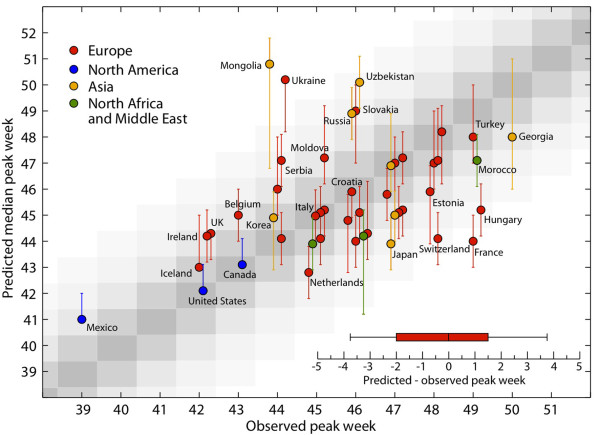
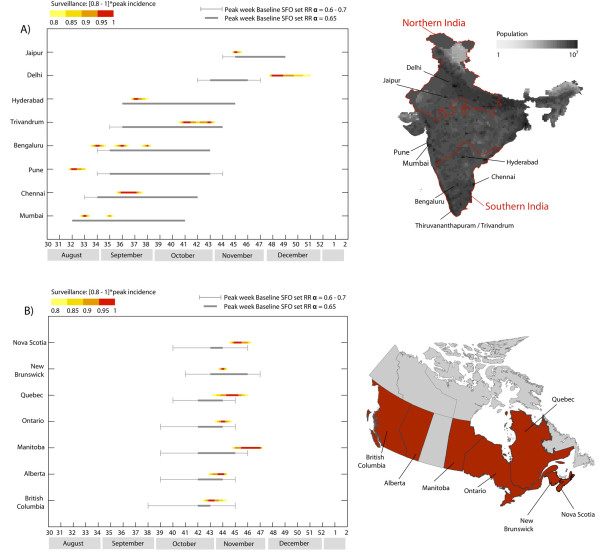
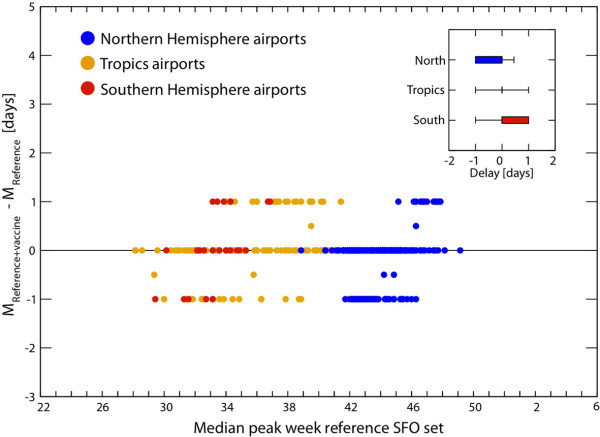
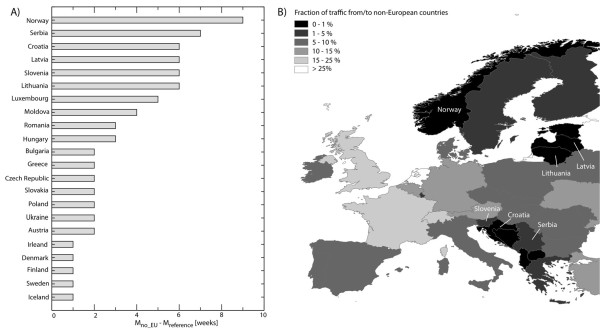
Results: Real-time predictions of the peak timing are found to be in good agreement with the empirical data, showing strong robustness to data that may not be accessible in real time (such as pre-exposure immunity and adherence to vaccination campaigns), but that affect the predictions for the attack rates. The timing and spatial unfolding of the pandemic are critically sensitive to the level of mobility data integrated into the model.

Conclusions: Our results show that large-scale models can be used to provide valuable real-time forecasts of influenza spreading, but they require high-performance computing. The quality of the forecast depends on the level of data integration, thus stressing the need for high-quality data in population-based models, and of progressive updates of validated available empirical knowledge to inform these models.


Figures

Figure 1
Figure 1
Natural history of influenza. After acquiring the infection, a susceptible individual enters the latent compartment, where he is infected but not yet infectious. After the average latency period, each infected individual becomes infectious, and may or may not show symptoms. Symptomatic cases are more infectious than asymptomatic cases. Finally, all infected individuals recover after the average infectious period and become immune to the disease.
Figure 2
Figure 2
Schematic illustration of the model flowchart. The Global Epidemic and Mobility (GLEAM) computational model is based on a data-driven approach. The left column represents the three input databases; the center column represents the dynamic processes that are modeled at each time step, along with their determinants; and the right column indicates example quantities for the model output. Each box is color-coded according to the corresponding dynamic process.
Figure 3
Figure 3
Monte Carlo Maximum Likelihood (MCML) method used to estimate the transmission potential of the A/H1N1 pandemic. (A) Schematic representation of the invasion dynamics of an emerging infectious disease from the seed subpopulation (red patch) to the neighboring subpopulations connected by means of mobility. The blue color code refers to the arrival time of the first infectious individual. Links of different width represent mobility connections characterized by different mobility flows. (B) Flow chart representing the steps that compose the Monte Carlo Maximum Likelihood (MCML) method. First, for each point in the parameter space, we ran 2,000 stochastic realizations, all with the same initial conditions. Second, for each run, we recorded the arrival times in the countries under study. Third, we compared the probability distribution built on the simulated arrival times with the empirically observed arrival times for each country. Finally, we evaluated the likelihood function to find its maximum value, corresponding to the set of parameters that best fits the data.
Figure 4
Figure 4
Travel-related measures in the early stage of the epidemic. (A) Probability distribution of the arrival time (date of arrival of the first symptomatic case) in Germany for different values of traffic reduction, ϕ. The vertical dotted line indicates the observed arrival time in the country, as obtained from official reports, and the vertical solid line indicates the starting date of the travel restrictions (25 April, 2009), which was the day after the international alert. The probability distributions were obtained from 2,000 stochastic realizations, and data were binned over 7 days. (B) Cumulative probability distributions of the first seeding event from Mexico to Germany for different values of traffic reduction ϕ. We considered any source of infection in the seeding event, including symptomatic cases and non-detectable infected cases, such as latent and asymptomatic. (C) Delay in the case importation from Mexico to a given country compared with the reference stochastic forecast output (SFO) as a function of the travel reduction ϕ. The delay was measured in terms of the date at which the cumulative distribution of the seeding from Mexico (B) reached 90%.
Figure 5
Figure 5
Peak timing in the northern hemisphere: simulations and real data. Peak weeks of the epidemic activity in the baseline stochastic forecast output (SFO) (gray). The reference ranges of the simulated peak week were obtained by analysis of 2,000 stochastic realizations of the model for three different values of the seasonal rescaling factor, αmin, of 0.6, 0.65, and 0.7. The peak weeks reported by the surveillance for the fall/winter wave are shown as color gradients, whose limits correspond to the time interval at which an incidence of greater than 80% of the maximum incidence was observed. The numbers 1 to 5 indicate the type of data provided by the surveillance of each country, and the numbered weeks of the year correspond to the calendar used by the US Center for Disease Control and Prevention.
Figure 6
Figure 6
Statistical association between the predicted and observed activity peaks. Peak week as simulated by the model in the baseline stochastic forecast output (SFO) set with αmin = 0.65 versus the peak week observed by surveillance systems in the countries outlined in Figure 5. The reference ranges of the simulated peak week were obtained by analysis of 2,000 stochastic realizations of the model. In the inset, we show the box plot indicating the distribution of the differences between the simulated peak week for the baseline SFO set with αmin = 0.65, and the observed peak week.
Figure 7
Figure 7
Peak timing in India and Canada: simulations and real data. (A) Peak weeks of the epidemic activity in the baseline stochastic forecast output (SFO) (gray) for eight Indian cities, ordered by decreasing latitude from top to bottom. Right: map of India, showing the Indian population distribution and the subdivision in North, South, and Central regions. (B) Peak weeks of the epidemic activity in the baseline SFO (gray) for seven Canadian provinces, ordered eastward from top to bottom. Right: map of Canada, where the Canadian provinces under study are highlighted in red. The 95% reference ranges of the simulated peak week were obtained by analysis of 2,000 stochastic realizations of the model for three different values of the seasonal rescaling factor, αmin = 0.6, 0.65, and 0.7. The peak weeks reported by the surveillance are shown as color gradients, whose limits correspond to the time interval where an incidence of greater than 80% of the maximum incidence was observed. Both maps were made exclusively for this manuscript and are not subject to copyright.
Figure 8
Figure 8
Peak timing: effect of vaccination campaigns. Difference in the median peak weeks in the reference stochastic forecast output (SFO) set with mass vaccination campaigns and the reference SFO set as a function of the median peak week in the reference SFO set, for the 500 busiest airports of the world. Dots are color-coded according to the corresponding airport's climatic zone. In the inset, we show the box plot indicating the distribution of the differences (in days) between the peak weeks of the two SFO sets. The differences were all limited to the minimal time scale used in the model (1 day) and thus were indistinguishable from stochastic fluctuations.
Figure 9
Figure 9
Clinical attack rate in the USA. The number of clinical A/H1N1 cases in the 2009 pandemic as estimated by the US Centers for Disease Control and Prevention (gray) and by two different stochastic forecast output (SFO) sets simulated by the Global Epidemic and Mobility (GLEAM) computational model, at six different dates between April 2009 and March 2010. The simulated results corresponded to the reference SFO set with vaccination and to the pre-exposure immunity SFO set with vaccinations, with the proportion of asymptomatic infections, pa, set to 45%. The bar indicates the median value and the error bar indicates the corresponding 95% reference range.
Figure 10
Figure 10
Clinical attack rates in the northern hemisphere. Estimated clinical attack rate of 26 selected countries in the northern hemisphere for the reference stochastic forecast output (SFO) set coupled with mass vaccination campaigns, and the pre-exposure immunity SFO set with vaccinations, both assuming a proportion of asymptomatic infections, pa, of 45%. The box plots indicate the 95% and 50% reference ranges, with the median value of the simulated attack rates obtained by the analysis of 2,000 stochastic realizations of the model for αmin being 0.65.
Figure 11
Figure 11
Cumulative attack rate: effect of vaccination campaigns and pre-exposure immunity. (A) Final vaccine uptake as a function of the mass vaccination starting date for the countries of the northern hemisphere (reported in Table 2). (B) Relative reduction of the final epidemic size in the reference stochastic forecast output (SFO) coupled with mass vaccination campaigns, with respect to the reference SFO, as a function of the final vaccine uptake. (C) Relative reduction of the final epidemic size in the pre-exposure immunity SFO coupled with vaccination campaigns, with respect to the reference SFO, as a function of the final uptake. The relative reduction of the epidemic size was calculated as the relative reduction of the maximum of the 95% reference range, obtained from 2,000 stochastic realizations, in the reference SFO set. In all SFO sets, we assumed the proportion of asymptomatic infections, pa, to be 33%.
Figure 12
Figure 12
Peak timing: effect of interventions by antiviral treatment. Peak weeks of the epidemic activity in the reference stochastic forecast output (SFO) (gray) and in the antiviral scenario (red), for a set of countries in the northern hemisphere. The 95% reference ranges of the simulated peak week were obtained by analysis of 2,000 stochastic realizations of the model for three different values of the seasonal rescaling factor, αmin: 0.6, 0.65, and 0.7.
Figure 13
Figure 13
Peak timing: effect of changes in the maximum seasonal rescaling. Difference in the median peak weeks in the reference stochastic forecast output (SFO) set, with αmax = 1.1 and αmax = 1.0, for the 500 busiest airports, as a function of the median peak week in the reference SFO set. Dots are color-coded according to the corresponding airport's climate zone. In the inset, we show the box plot indicating the distribution of the differences (in days) between the peak week of the reference SFO set and the SFO set with αmax = 1.0. Differences were fairly limited and generally fell within a period of 2 weeks.
Figure 14
Figure 14
Peak timing: effect of sampling of the mobility network limited to the top 500 airports. Difference in the median peak weeks in the reference stochastic forecast output (SFO) set, where the full mobility dataset was considered, and the top 500 scenario, for the 500 busiest airports, as a function of the median peak week in the reference SFO set. Dots are color-coded according to the corresponding airport's climate zone. In the inset, we show the box plot indicating the distribution of the differences (in days) between the peak week of the reference SFO set and the SFO set considering only the top 500 airports. The differences were considerable, with median differences of about 3 weeks.
Figure 15
Figure 15
Peak timing: effect of intra-EU mobility connections. (A) Delay of the A/H1N1 pandemic peak time in the scenario with no intra-EU air connections, with respect to the reference stochastic forecast output (SFO) set, for 22 European countries. (B) Map of Europe, showing for each country the fraction of traffic directed to and from non-European countries. Countries with small extra-European connections experienced the largest delay in the A/H1N1 pandemic peak time. The map was made exclusively for this manuscript and is not subject to copyright.

References

    1. Riley S. Large-scale transmission models of infectious disease. Science. 2007;316:1298–1301. doi: 10.1126/science.1134695. - DOI - PubMed
    1. Balcan D, Hu H, Gonçalves B, Bajardi P, Poletto C, Ramasco JJ, Paolotti D, Perra N, Tizzoni M, Van den Broeck W, Colizza V, Vespignani A. Seasonal transmission potential and activity peaks of the new influenza A/H1N1: a Monte Carlo likelihood analysis based on human mobility. BMC Med. 2009;7:45. doi: 10.1186/1741-7015-7-45. - DOI - PMC - PubMed
    1. Balcan D, Colizza V, Gonçalves B, Hu H, Ramasco JJ, Vespignani A. Multiscale mobility networks and the large scale spreading of infectious diseases. Proc Natl Acad Sci USA. 2009;106:21484–21489. doi: 10.1073/pnas.0906910106. - DOI - PMC - PubMed
    1. Grais RF, Hugh Ellis J, Glass GE. Assessing the impact of airline travel on the geographic spread of pandemic influenza. Eur J Epidemiol. 2003;18:1065–1072. doi: 10.1023/A:1026140019146. - DOI - PubMed
    1. Colizza V, Barrat A, Barthélemy M, Valleron A-J, Vespignani A. Modeling the World-wide spread of pandemic influenza: baseline case and containment interventions. PLoS Med. 2007;4:e13. doi: 10.1371/journal.pmed.0040013. - DOI - PMC - PubMed

Publication types