. 2013 May;57(5):2014-25.
doi: 10.1002/hep.26197. Epub 2013 Apr 5.

A20 promotes liver regeneration by decreasing SOCS3 expression to enhance IL-6/STAT3 proliferative signals

Affiliations

A20 promotes liver regeneration by decreasing SOCS3 expression to enhance IL-6/STAT3 proliferative signals

Cleide G da Silva et al. Hepatology. 2013 May.

Abstract

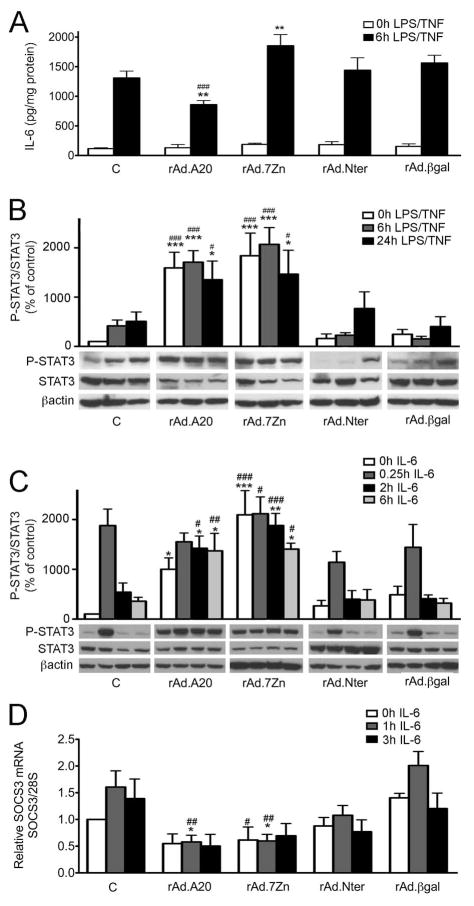
Liver regeneration is of major clinical importance in the setting of liver injury, resection, and transplantation. A20, a potent antiinflammatory and nuclear factor kappa B (NF-κB) inhibitory protein, has established pro-proliferative properties in hepatocytes, in part through decreasing expression of the cyclin dependent kinase inhibitor, p21. Both C-terminal (7-zinc fingers; 7Zn) and N-terminal (Nter) domains of A20 were required to decrease p21 and inhibit NF-κB. However, both independently increased hepatocyte proliferation, suggesting that additional mechanisms contributed to the pro-proliferative function of A20 in hepatocytes. We ascribed one of A20's pro-proliferative mechanisms to increased and sustained interleukin (IL)-6-induced signal transducer and activator of transcription 3 (STAT3) phosphorylation, as a result of decreased hepatocyte expression of the negative regulator of IL-6 signaling, suppressor of cytokine signaling 3 (SOCS3). This novel A20 function segregates with its 7Zn not Nter domain. Conversely, total and partial loss of A20 in hepatocytes increased SOCS3 expression, hampering IL-6-induced STAT3 phosphorylation. Following liver resection in mice pro-proliferative targets downstream of IL-6/STAT3 signaling were increased by A20 overexpression and decreased by A20 knockdown. In contrast, IL-6/STAT3 proinflammatory targets were increased in A20-deficient livers, and decreased or unchanged in A20 overexpressing livers. Upstream of SOCS3, levels of its microRNA regulator miR203 were significantly decreased in A20-deficient livers.

Conclusion: A20 enhances IL-6/STAT3 pro-proliferative signals in hepatocytes by down-regulating SOCS3, likely through a miR203-dependent manner. This finding together with A20 reducing the levels of the potent cell cycle brake p21 establishes its pro-proliferative properties in hepatocytes and prompts the pursuit of A20-based therapies to promote liver regeneration and repair.


Figures

Fig. 1
Fig. 1. C-terminal and N-terminal domains of A20 independently promote hepatocyte proliferation but neither can independently decrease p21 expression or inhibit IκBα degradation
A. NMuLi cells were transduced with rAd.A20, rAd.7Zn and rAd.Nter, serum starved for 24h to synchronize their cell cycle, then supplemented with 10% FBS enriched medium to drive cell proliferation. Cell count/well was evaluated 24h later by Trypan blue exclusion and plotted as mean ± SEM of 3–6 independent experiments. B. Relative p21 mRNA levels measured by qPCR in HepG2 cells transduced with rAd.A20, rAd.7Zn and rAd.Nter for 48h. Histograms represent mean± SEM of relative mRNA levels after normalization by βactin mRNA (n=3–5 independent experiments). C. Representative IκBα Western blot of cell lysates from rAd.A20, rAd.7Zn and rAd.Nter HepG2 cells treated with TNF (200 U/mL) for 15 min. βactin was used for loading control (n=3 independent experiments). Non-transduced (C) and rAd.βgal transduced cells were used as controls. *p<0.05, **p<0.01.
Fig. 2
Fig. 2. Overexpression of A20 increases IL-6 induced STAT3 phosphorylation through down-regulation of SOCS3 expression, despite lower IL-6 production
HepG2 were non-transduced (C), or transduced with rAd.A20, rAd.7Zn, rAd.Nter, and control rAd.βgal A. IL-6 levels were determined by ELISA in cell culture supernatants 6h following TNF (200 U/mL) and LPS (10ng/mL). Results are expressed as mean ± SEM of 4–7 independent experiments. Representative phospho (P-STAT3) and total STAT-3 Western blots following B. TNF (200 U/mL) and LPS (10ng/mL) for 6 to 24 h or C. IL-6 (50 ng/mL) for 15 min to 6 h. βactin was used as loading control. Corrected densitometry results, presented as percentage of control non-stimulated cells, are expressed as mean ± SEM of 3–5 independent experiments. D. Relative SOCS3 mRNA levels were measured by qPCR 1h to 3h following IL-6 (50 ng/mL). Histograms represent mean ± SEM of relative mRNA levels after normalization with 28S (n=4–5 independent experiments). *p<0.05, **p<0.01 and ***p< 0.001 vs. C, and #p<0.05, ##p<0.01 and ###p< 0.001 vs. rAd.βgal within each treatment group.
Fig. 3
Fig. 3. A20 knockdown increases IL-6 production but decreases IL-6 induced STAT3 phosphorylation by up-regulating SOCS3
A. A20 mRNA levels in mouse primary hepatocytes (MPH) isolated from WT, A20 HT and A20 KO livers, as measured by qPCR. Histograms represent mean ± SEM of relative A20 mRNA levels after normalization with βactin (n=3 mice per group). B. IL-6 levels determined by ELISA in cell culture supernatants of MPH 6h following TNF (200 U/mL). Results are expressed as mean ± SEM of 3–6 independent experiments. C. Representative phospho (P-STAT3) and total STAT-3 Western blots of MPH treated with IL-6 (50 ng/mL) for 30 min to 6 h. GAPDH was used as loading control. Corrected densitometry results, presented as percentage of WT non-stimulated cells are expressed as mean ± SEM of 3 independent experiments. D. Relative SOCS3 mRNA levels measured by qPCR in MPH cultures stimulated for 1h to 3h with IL-6 (50ng/mL). Histograms represent mean± SEM of relative mRNA levels after normalization with βactin (n= 4–5 independent experiments). *p<0.05, **p<0.01 and ***p< 0.001.
Fig. 4
Fig. 4. A20 knockdown increases SOCS3 expression, which inversely correlates with lower miR-203 levels
Livers of 4–5 weeks old WT, A20 HT and A20 KO mice were analyzed for A. SOCS3 mRNA levels by qPCR. Histograms represent mean ± SEM of relative SOCS3 mRNA levels after normalization with βactin (n=7–9 mice per group). B. Graph representing mean±SEM of SOCS3 positive hepatocytes per high power field (HPF), as analyzed C. by immunohistochemistry (brown). Double immunofluorescence staining, using fluorescence labeled SOCS3 and hepatocyte specific albumin antibodies (SOCS3: green; albumin: red; DAPI: blue), confirmed that SOCS3 positive cells were hepatocytes. D. Graph representing mean±SEM of P-STAT3 positive hepatocytes per HPF, as analyzed by E. immunohistochemistry (brown). Double immunofluorescence staining, using fluorescence labeled P-STAT3 and hepatocyte specific hepatocyte nuclear factor 4 α (HNF) (P-STAT3: red; HNF: green; DAPI: blue). Yellow arrows indicate P-STAT3/HNF/DAPI positive hepatocytes; pink arrows indicate P-STAT3/DAPI positive but HNF negative cells. Photomicrographs are representative of 3–4 mice per group. Original magnification X200 (light microscopy) and X400 (fluorescence microscopy). F. Histograms representing mean ± SEM of relative miR-203 mRNA levels measured by qPCR after normalization with the house keeping miRNA gene sno202 (n= 5–7 mice per group). *p<0.05 **p< 0.01 and ***p< 0.001.
Fig. 5
Fig. 5. Overexpression of A20 in livers down-regulates SOCS3 to promote hepatocyte proliferation following extended hepatectomy
Livers from mice that did not receive recombinant adenovirus (C) or were injected with rAd.A20 or rAd.βgal were recovered before (pre) and 24h (mRNA) or 36h (immmunostaining) after extended hepatectomy (post) and evaluated for A. SOCS3 mRNA levels by qPCR. Histograms represent mean ± SEM relative SOCS3 mRNA levels (n= 3–6 mice per group). B. SOCS3 protein expression by immunohistochemistry (brown) (n=5–6 mice per group). C. Cyclin D1 (CCND1) and D. Cyclin A (CCNA) mRNA levels by qPCR. Histograms represent mean ± SEM relative CCND1 and CCNA mRNA levels (n= 3–6 mice per group). E. Hepatocyte proliferation was evaluated by Ki67 immunostaining (brown). Double immunofluorescence, using fluorescence labeled Ki67 and hepatocyte specific HNF (Ki67: red; HNF: green; DAPI: blue), confirm that ki67 positive cells are hepatocytes. Histograms represents mean±SE of Ki67 positive hepatocytes per HPF. Photomicrographs in B and E are representative of 5–6 (light microscopy) or 3–6 (fluorescence microscopy) mice per group. Original magnification ×200 (light microscopy) and ×400 (fluorescence microscopy). mRNA levels in A, C, D were normalized using TATA box binding protein (TBP) mRNA. *p<0.05, **p<0.01, ***p<0.001
Fig. 6
Fig. 6. A20 knockdown increases SOCS3 expression, impairing hetapocyte proliferation following extended hepatectomy
Mice livers from A20 WT and A20 HT mice were recovered and evaluated for A. SOCS3 mRNA levels by qPCR and protein expression by immunohistochemistry (brown), before (pre) and 24h after (post) EH. Histograms represent mean ± SEM relative SOCS3 mRNA levels (n= 5–6 mice per group). Photomicrographs are representative of 5–6 mice per group. B. miR-203 mRNA levels by qPCR, pre and 24h post EH. Hitograms represent mean ± SEM relative miR203 mRNA levels after normalization with the house keeping miRNA gene sno202 (n= 5–6 mice per group). C. Hepatocyte proliferation by Ki67 immunostaining (brown) and double immunofluorescence (Ki67: red; hepatocyte nuclear factor 4α (HNF): green; DAPI: blue), pre and 36h post EH. Histograms represent mean ± SEM of Ki67 positive cells per high power field (HPF) (n=2 (WT) and 5 (HT) mice). D. phospho (P-STAT3) and total STAT-3 by Western blot analysis, pre and 4h post EH. Immunoblots for GAPDH were used as loading control. Histograms represent mean ± SEM of corrected densitometry results, calculated as percentage of P-STAT3/STAT3 ratio in pre WT livers. E. Cyclin D1 (CCND1) and F. Cyclin A (CCNA) mRNA levels, by qPCR pre and 24h post EH. Histograms represent mean ± SEM of relative CCND1 and CCNA mRNA levels (n= 5–6 mice per group). Original magnification in A and C were ×200 (light microscopy) and ×400 (fluorescence microscopy). In A, E, and F mRNA levels were normalized using TATAbox binding protein (TBP) mRNA.*p<0.05, ***p<0.001.
Fig. 7
Fig. 7. A20 expression regulates acute phase response gene expression following liver resection
Serum Amyloid A 1 (SAA1) and fibrinogen gamma chain (FGG) mRNA levels were evaluated by qPCR in livers from: A and B. rAd.A20 and rAd.βgal transduced livers, and C and D WT and A20 HT livers before (pre) and 24h after (post) EH (n=5–6 mice per group). Histograms represent mean ± SEM of relative target gene mRNA levels after normalization with TATA box binding protein (TBP). **p<0.01.
Fig. 8
Fig. 8. A20 promotes proliferative and reduces inflammatory IL-6/STAT3 signals
In response to decreased liver mFfigass and relative increase in hepatic LPS concentration, activated kupffer cells secrete tumor necrosis factor alpha (TNF). When bound to TNF, the TNF receptor transduces mitogenic but also pro-inflammatory signals in neighboring hepatocytes, which are mediated by the transcription factor NF-κB. Activation of NF-κB occurs via phosphorylation of the NF-κB inhibitor IκBα, resulting in the dissociation and subsequent nuclear localization of phosphorylated NF-κB (p65/p50), initiating transcription of NF-κB dependent genes such as IL-6 and the NF-κB regulatory protein A20/tnfaip3. Upon IL-6 binding, the IL-6R/gp130 dimer induces phosphorylation of JAK1 and 3, which in turn phosphorylates STAT3. Phosphorylated STAT3 dimerizes and translocates to the nucleus, where it binds STAT3 binding element (SBE) and initiates transcription of cyclins, acute phase proteins, and the negative regulator of IL-6 signaling, socs3. A20 regulates IL-6/STAT3 signaling by increasing miR203 levels, which downregulates SOCS3 mRNA thus unleashes STAT3 signaling and transcription of STAT3-dependent mitogenic genes such as cyclin d1 and cyclin a. On the other hand, A20 blocks NF-κB signaling, thus reducing transcription of STAT3-dependent proinflammatory genes, such as saa1 and fgg, whose transcription relies on synergy between STAT3 and NF-κB. In sum overexpression of A20 in hepatocytes promotes their proliferation by favoring IL-6 proliferative over inflammatory signals.

References

    1. Fausto N, Campbell JS, Riehle KJ. Liver regeneration. Hepatology. 2006;43:S45–53. - PubMed
    1. Michalopoulos GK. Liver regeneration. J Cell Physiol. 2007;213:286–300. - PMC - PubMed
    1. Cressman DE, Diamond RH, Taub R. Rapid activation of the Stat3 transcription complex in liver regeneration. Hepatology. 1995;21:1443–1449. - PubMed
    1. Galun E, Zeira E, Pappo O, Peters M, Rose-John S. Liver regeneration induced by a designer human IL-6/sIL-6R protein reverses severe hepatocellular injury. FASEB J. 2000;14:1979–1987. - PubMed
    1. Cressman DE, Greenbaum LE, DeAngelis RA, Ciliberto G, Furth EE, Poli V, Taub R. Liver failure and defective hepatocyte regeneration in interleukin-6-deficient mice. Science. 1996;274:1379–1383. - PubMed

MeSH terms

Substances