. 2013 Feb 15;126(Pt 4):879-88.
doi: 10.1242/jcs.118075. Epub 2012 Dec 13.

The endocannabinoid N-arachidonoyl glycine (NAGly) inhibits store-operated Ca2+ entry by preventing STIM1-Orai1 interaction

Affiliations

The endocannabinoid N-arachidonoyl glycine (NAGly) inhibits store-operated Ca2+ entry by preventing STIM1-Orai1 interaction

Andras T Deak et al. J Cell Sci. .

Abstract

The endocannabiniod anandamide (AEA) and its derivate N-arachidonoyl glycine (NAGly) have a broad spectrum of physiological effects, which are induced by both binding to receptors and receptor-independent modulations of ion channels and transporters. The impact of AEA and NAGly on store-operated Ca(2+) entry (SOCE), a ubiquitous Ca(2+) entry pathway regulating many cellular functions, is unknown. Here we show that NAGly, but not AEA reversibly hinders SOCE in a time- and concentration-dependent manner. The inhibitory effect of NAGly on SOCE was found in the human endothelial cell line EA.hy926, the rat pancreatic β-cell line INS-1 832/13, and the rat basophilic leukemia cell line RBL-2H3. NAGly diminished SOCE independently from the mode of Ca(2+) depletion of the endoplasmic reticulum, whereas it had no effect on Ca(2+) entry through L-type voltage-gated Ca(2+) channels. Enhanced Ca(2+) entry was effectively hampered by NAGly in cells overexpressing the key molecular constituents of SOCE, stromal interacting molecule 1 (STIM1) and the pore-forming subunit of SOCE channels, Orai1. Fluorescence microscopy revealed that NAGly did not affect STIM1 oligomerization, STIM1 clustering, or the colocalization of STIM1 with Orai1, which were induced by Ca(2+) depletion of the endoplasmic reticulum. In contrast, independently from its slow depolarizing effect on mitochondria, NAGly instantly and strongly diminished the interaction of STIM1 with Orai1, indicating that NAGly inhibits SOCE primarily by uncoupling STIM1 from Orai1. In summary, our findings revealed the STIM1-Orai1-mediated SOCE machinery as a molecular target of NAGly, which might have many implications in cell physiology.


Figures
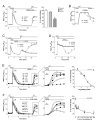
Figure 1
Figure 1. NAGly but not AEA inhibits SOCE signals in endothelial cells
(A) Left panel Representative curves of fura-2/AM loaded EA.hy926 cells stimulated for 2 minutes with 1 μM thapsigargin (Tg) and 100 μM histamine (His) in 1 mM EGTA. 3 minutes prior to Ca2+ addition cells were treated with either ethanol (control; black, n=60 cells/6 independent experiments) or 10 μM NAGly (grey, n=81/6) or 10 μM anandamide (AEA, dashed, n=77/6) Right panel Bars represent mean slopes of Ca2+ increase upon Ca2+ readdition of curves displayed in the left panel. *p<0.0001 vs. control. (B) [Ca2+]cyto elevation in response to Ca2+ addition after ER Ca2+ depletion as described in (A). Once Ca2+ entry reached a steady-state, cells were treated with 10 μM NAGly (grey, filled circles, 33/3) or not (black, open circles n=29/3). *p <0.0001 vs. − NAGly. (C) Representative curves showing the effect of NAGly washout (− NAGly, grey, filled circles, n=10) during SOCE. In respective control experiments, NAGly was present until the end (+ NAGly, black, open circles n=25). 15 μM BHQ was used for SERCA inhibition. *p <0.0001 vs. +NAGly. (D) The reversibility of 10 μM NAGly on [Ca2+]cyto elevation was tested during cell stimulation with 100 μ M histamine in the presence of 2 mM Ca2+ (− NAGly, black, open circles n=16; + NAGly, grey, filled circles, n=17).*p <0.0001 vs. − NAGly. (E) Left panel Concentration response experiments regarding the inhibitory effect of NAGly on SOCE in protocols as described in (A), cells were incubated with 0.3 – 30 μM concentrations of NAGly (n=20-30 cells each), while control cells (n=34) received no treatment. The F340/F380 ratio was normalized to the maximal Ca2+ entry of control cells, where the delta maximum of [Ca2+]cyto elevation in response to Ca2+ addition was defined as 100%. Middle panel: Zoom in on Ca2+ entry phases displayed in the left panel. Right panel: Concentration-inhibition curve of NAGly on SOCE. Symbols correspond to slopes of [Ca2+]cyto elevation upon Ca2+ addition as a percentage of control. Data were fitted with a dose-inhibition sigmoidal equation. IC50=4.22 (1.82 – 9.87) μM. (F) Left panel Experiments show the time-dependent effect of NAGLy on SOCE. After ER Ca2+ depletion cells were incubated with 10 μM NAGly starting 360, 180, 60, 30, or 15 s prior to or simultaneously with (0 s) Ca2+ addition as indicated by arrows (n=13-20 cells each). The F340/F380 ratio was normalized to the maximal Ca2+-entry (considered as 100 %) of control cells (n=24) which did not receive NAGly. Middle panel: Zoom in of Ca2+ entry phases displayed in the left panel. Right panel: Incubation time-dependent inhibitory effect of NAGly on SOCE. Symbols correspond to slopes of [Ca2+]cyto elevation upon Ca2+ addition as a percentage of control. *p <0.0001 vs. control.
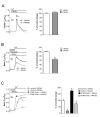
Figure 2
Figure 2. NAGly specifically reduces SOCE in INS-1 and attenuates enhanced SOCE in endothelial cells overexpressing STIM1 and Orai1
(A) Left panel: Voltage dependent Ca2+ entry in fura-2/AM loaded INS-1 832/13 cells that were stimulated with 30 mM K+ in the presence of 2 mM Ca2+ and 20 mM glucose without NAGly (black, n=137/6) or with 10 μM NAGly (grey, n=131/6). Right panel: Bars represent slopes of Ca2+-increase as a percentage of control (− NAGly) calculated from experiments displayed in the left panel. (B) Left panel: In the presence of 400 μM diazoxide and 20 mM glucose ER Ca2+ was depleted with 1 μM Tg. After 10 minutes, 2 mM Ca2+ was added in the absence (black, n=137/6) or presence of 10 μ M NAGly (grey, n=131/6). Right panel: Bars represent slopes of Ca2+-increase as a percentage of control (− NAGly) calculated from experiments displayed in the left panel. *p<0.001 vs. − NAGly. (C) Left panel: Average curves of fura-2/AM loaded EA.hy926 cells in response to Ca2+ addition after ER Ca2+ depletion (using 1 μM Tg and 100 μM His) under control conditions without NAGly (black continuous, n=30/6) with 10 μ M NAGly (grey, continuous, n=39/6) and in cells co-expressing YFP-STIM1 and CFP-Orai1 in the absence (black dashed line, n=38/8) or presence of 10 μ M NAGly (grey dashed line, n=39/8). Right panel: Respective statistical analysis of data displayed on left panel. Mean slope of [Ca2+]cyto increase is displayed as a percentage of untreated control cells expressing the cytosolic FP Venus. Slopes were calculated using linear regression between the initial onsets until the individual plateau phases were reached*p <0.0001 vs. control (− NAGly). # p <0.0001 vs. STIM1/Orai1 (− NAGly).
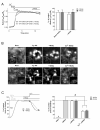
Figure 3
Figure 3. NAGly is neither affecting STIM1 oligomerization nor STIM1 clustering
(A) Left panel: Dynamics of STIM1 oligomerization measured by FRET in EA.hy926 cells overexpressing YFP-STIM1 and CFP-STIM1. Oligomerization was triggered by 1 μM Tg and 100 μM His in the absence of extracellular Ca2+ and cells were subsequently treated with 10 μM NAGly (+ NAGly, grey, n=14/7), while control cells (− NAGly, black, n=16/7) received no treatment. Right panel: Bars represent the ΔRatio (F535/F480)/R0 from experiments presented in the left panel. FRET signals of control experiments before the addition of NAGly were defined as 100 %. (B) Representative confocal images of subplasmalemmal STIM-clusters with zooms in control (upper panel) and in NAGly treated (lower panel) cells co-expressing YFP-STIM1 and CFP-Orai1 under resting condition (Rest), following 1μM Tg and 100 μM His stimulation in the absence of Ca2+ (Tg/His), after ethanol (− NAGly) or 10 μM NAGly treatment (+ NAGly) and subsequent 2 mM Ca2+-addition (Ca2+). Scale bars represent 10 μm. (C) Left panel: Representative tracings of individual STIM1-cluster formation over time upon ER Ca2+ depletion and Ca2+ addition. Areas of clusters were normalized to respective individual maximal cluster areas (defined as 100 %). Right panel: Statistical analysis of STIM1-cluster areas under resting condition (Rest), after maximal store depletion (Tg/His), after ethanol (− NAGly) or NAGly treatment (+ NAGly) and after Ca2+ addition (Ca2+) as indicated. Bars represent mean STIM1-cluster areas of 10-15 clusters per cell in 3 independent experiments for both conditions. *p <0.0001 vs. cells treated with Tg/His in the absence of NAGly, #p<0.0001 vs Tg/His.
Figure 4
Figure 4. NAGly is not affecting the co-localization between STIM1 and Orai1 but diminishes STIM1/Orai1 interaction
(A) Confocal images of EA.hy926 cells co-expressing YFP-STIM1 (left images) and CFP-Orai1 (middle images) and respective merges (right images) with zooms to ER-PM junctions under resting resting conditions (upper panel), upon ER Ca2+ depletion with 1 μM Tg and 100 μM His after 4 minutes (middle panel) and 12 minutes (lower panel). Scale bars and zooms represent 10 μm (B) Confocal images of YFP-STIM1 (left images), CFP-Orai1 (middle images) and respective merges (right images) with zooms as described in A, while the lower images show a representative cell treated with 10 μM NAGly. Scale bars and zooms represent 10 μm. (C) Statistical analysis of YFP-STIM1 and CFP-Orai1 co-localization under conditions represented in A (− NAGly, n=10/10) and B (+ NAGly, n=11/11). STIM1/Orai1 co-localization of individual cells upon cell stimulation was normalized to the respective co-localization under resting conditions. *p <0.0001 vs. Rest. (D) Dynamic FRET measurments between Orai1-YFP and STIM1-CFP corresponding to STIM1/Orai1 interaction in EA.hy926 cells. Interaction was triggered with 1 μM Tg and 100 μM His in the absence of extracellular Ca2+ and cells were subsequently exposed to 10 μM NAGly, Left panel: Representative tracings of individual FRET (green) and CFP (cyan) emission signals over time that were corrected for photobleaching. Left middle panel: Statistical evaluation of intensity changes following Tg/His (left columns; n=6/6) and NAGly treatment (right columns; n=6/6). Right middle panel: Representative tracing of changes in FRET ratio calculated from intensity values shown in left panel. Right panel: Statsitical evealution of the inhibitory effect of NAGly on STIM1/Orai1 interaction. The grey column represents an average of normalized ΔFRET ratios 3 minutes after addition of 10 μM NAGly (+ NAGly; n=14/9), while the white column shows the average of respective ΔFRET ratios of NAGly untreated cells (− NAGly, n=15/8). The maximal FRET signal at the time point before NAGly addition was defined as 100 %. *p <0.0001 vs. − NAGly. (E) Dynamic FRET measurments between STIM1-YFP and CFP-Orai1 in the experimental protocol described above. Left panel: Dynamic changes of normalized average FRET ratios over time (n=7/5). Right panel: Representative pseudocolored FRET images of YFP/CFP ratio of cells under basal conditions (i), following Tg/His stimulation (ii), and after NAGly treatment (iii). Increased FRET signals appear as red pixels. Scale bars represent 10 μm (F) Representative tracings demonstrating the reversible effect of NAGly on STIM1/Orai1 interaction in Orai1-YFP/STIM1-CFP transfected cells. (G) Dynamic measurements of fluorescence signals in EA.hy926 cells co-expressing Orai1-YFP and CFP-STIM1. Notably, as the CFP was fused to the N-terminus of STIM1 facing the lumen of the ER, FRET between CFP-STIM1 and Orai1-YFP was absent due to the different compartmentalization of the respective fluorophores. Cells were stimulated with Tg/His in the absence of extracellular Ca2+ and subsequently exposed to 10 μM NAGly (+ NAGly, grey, n=8/6) while control cells (− NAGly, black, n=7/5) received no treatment.

References

    1. Alam MR, Groschner LN, Parichatikanond W, Kuo L, Bondarenko AI, Rost R, Waldeck-Weiermair M, Malli R, Graier WF. Mitochondrial Ca2+ uptake 1 (MICU1) and mitochondrial Ca2+ uniporter (MCU) contribute to metabolism-secretion coupling in clonal pancreatic β-cells. J Biol Chem. 2012;287:34445–34454. - PMC - PubMed
    1. Barbara G, Alloui A, Nargeot J, Lory P, Eschalier A, Bourinet E, Chemin J. T-type calcium channel inhibition underlies the analgesic effects of the endogenous lipoamino acids. J Neurosci. 2009;29:13106–13114. - PMC - PubMed
    1. Bondarenko AI, Malli R, Graier WF. The GPR55 agonist lysophosphatidylinositol directly activates intermediate-conductance Ca2+ -activated K+ channels. Pflugers Arch. 2011;462:245–255. - PMC - PubMed
    1. Bondarenko AI, Malli R, Graier WF. The GPR55 agonist lysophosphatidylinositol acts as an intracellular messenger and bidirectionally modulates Ca2+ -activated large-conductance K+ channels in endothelial cells. Pflugers Arch. 2011;461:177–189. - PMC - PubMed
    1. Bradshaw HB, Rimmerman N, Hu SSJ, Benton VM, Stuart JM, Masuda K, Cravatt BF, O’Dell DK, Walker JM. The endocannabinoid anandamide is a precursor for the signaling lipid N-arachidonoyl glycine by two distinct pathways. BMC Biochem. 2009;10:14. - PMC - PubMed

Publication types

MeSH terms