

The performance of different propensity score methods for estimating marginal hazard ratios
- PMID: 23239115
- PMCID: PMC3747460
- DOI: 10.1002/sim.5705
The performance of different propensity score methods for estimating marginal hazard ratios
Abstract
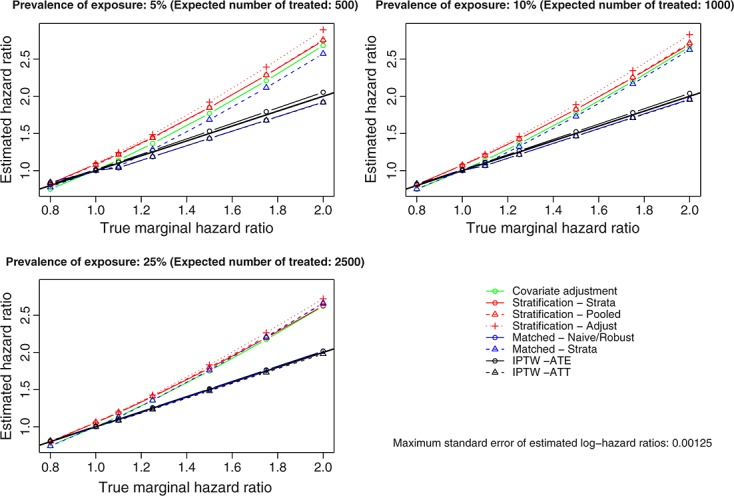
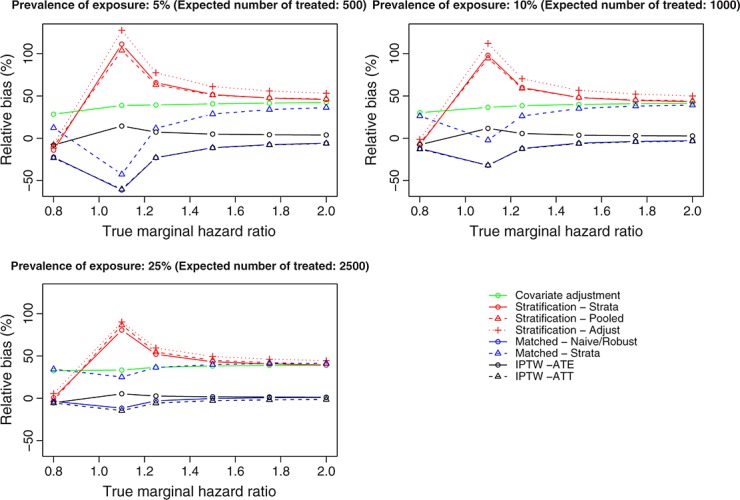
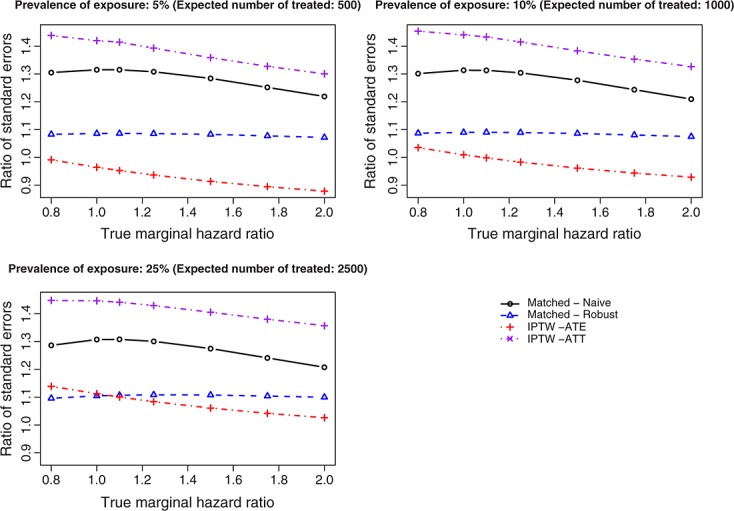
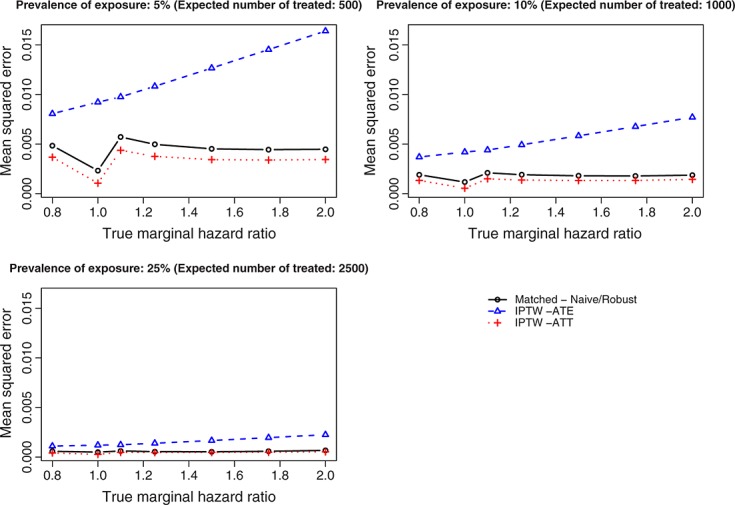
Propensity score methods are increasingly being used to reduce or minimize the effects of confounding when estimating the effects of treatments, exposures, or interventions when using observational or non-randomized data. Under the assumption of no unmeasured confounders, previous research has shown that propensity score methods allow for unbiased estimation of linear treatment effects (e.g., differences in means or proportions). However, in biomedical research, time-to-event outcomes occur frequently. There is a paucity of research into the performance of different propensity score methods for estimating the effect of treatment on time-to-event outcomes. Furthermore, propensity score methods allow for the estimation of marginal or population-average treatment effects. We conducted an extensive series of Monte Carlo simulations to examine the performance of propensity score matching (1:1 greedy nearest-neighbor matching within propensity score calipers), stratification on the propensity score, inverse probability of treatment weighting (IPTW) using the propensity score, and covariate adjustment using the propensity score to estimate marginal hazard ratios. We found that both propensity score matching and IPTW using the propensity score allow for the estimation of marginal hazard ratios with minimal bias. Of these two approaches, IPTW using the propensity score resulted in estimates with lower mean squared error when estimating the effect of treatment in the treated. Stratification on the propensity score and covariate adjustment using the propensity score result in biased estimation of both marginal and conditional hazard ratios. Applied researchers are encouraged to use propensity score matching and IPTW using the propensity score when estimating the relative effect of treatment on time-to-event outcomes.
Copyright © 2012 John Wiley & Sons, Ltd.
Figures


References
-
- Cook TD, DeMets DL. Introduction to Statistical Methods for Clinical Trials. Boca Raton, FL: Chapman & Hall/CRC; 2008.
-
- Rosenbaum PR, Rubin DB. The central role of the propensity score in observational studies for causal effects. Biometrika. 1983;70:41–55.
-
- Weitzen S, Lapane KL, Toledano AY, Hume AL, Mor V. Principles for modeling propensity scores in medical research: a systematic literature review. Pharmacoepidemiology and Drug Safety. 2004;13(12):841–853. - PubMed
-
- Austin PC. A critical appraisal of propensity-score matching in the medical literature between 1996 and 2003. Statistics in Medicine. 2008;27(12):2037–2049. - PubMed
-
- Austin PC, Manca A, Zwarenstein M, Juurlink DN, Stanbrook MB. A substantial and confusing variation exists in handling of baseline covariates in randomized controlled trials: a review of trials published in leading medical journals. Journal of Clinical Epidemiology. 2010;63(2):142–153. - PubMed
Publication types
MeSH terms
Grants and funding
LinkOut - more resources
Full Text Sources
Other Literature Sources
