

Identification and migration of primordial germ cells in Atlantic salmon, Salmo salar: characterization of vasa, dead end, and lymphocyte antigen 75 genes
- PMID: 23239145
- PMCID: PMC3664433
- DOI: 10.1002/mrd.22142
Identification and migration of primordial germ cells in Atlantic salmon, Salmo salar: characterization of vasa, dead end, and lymphocyte antigen 75 genes
Abstract
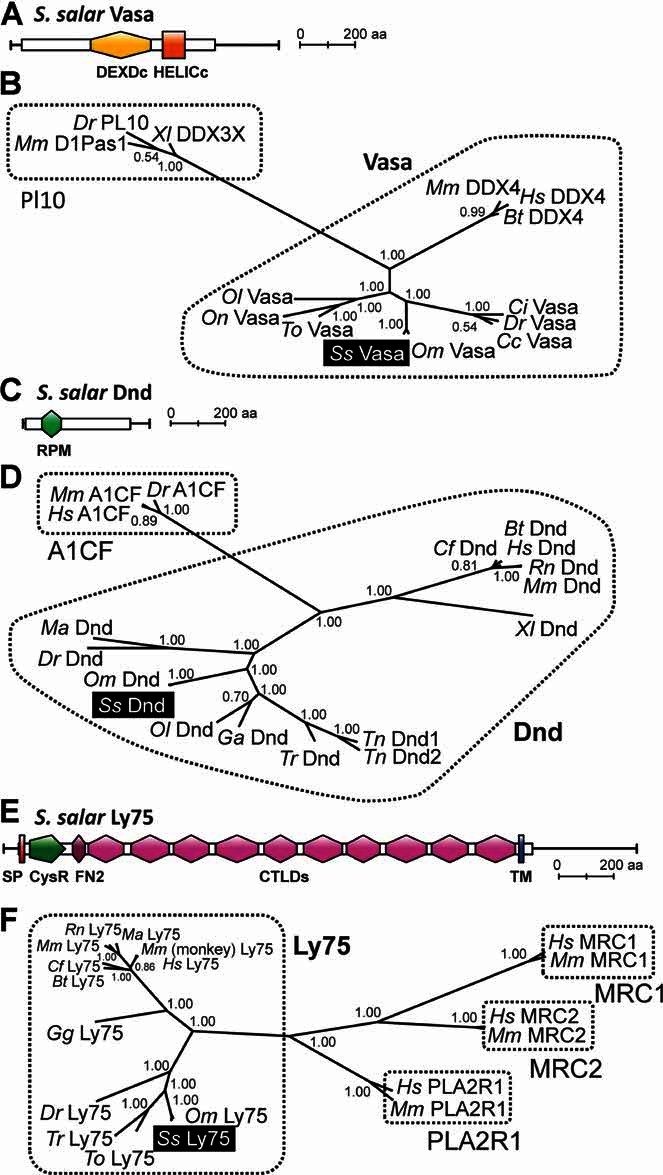
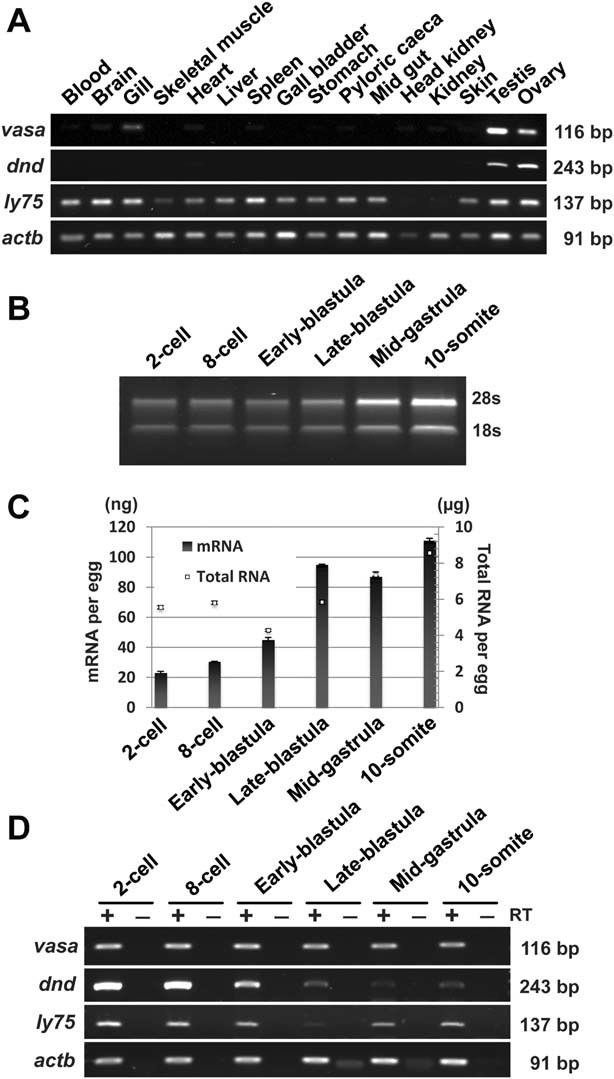
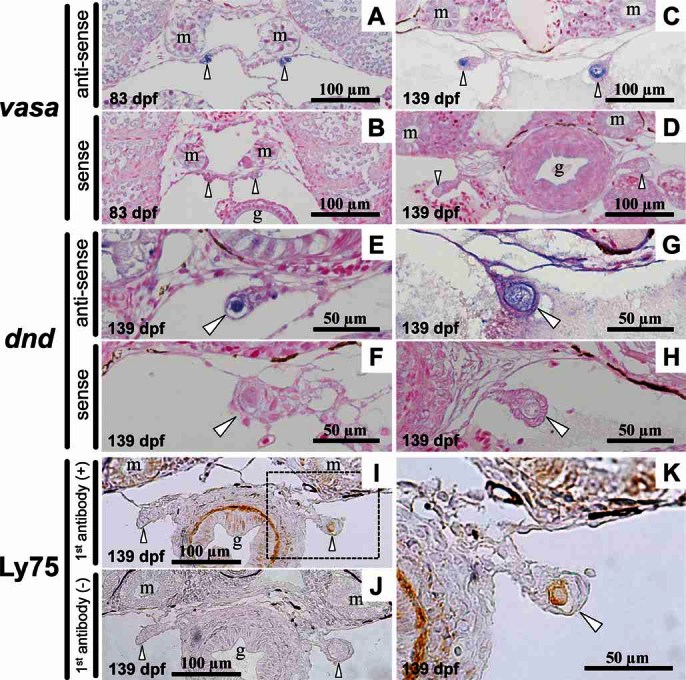
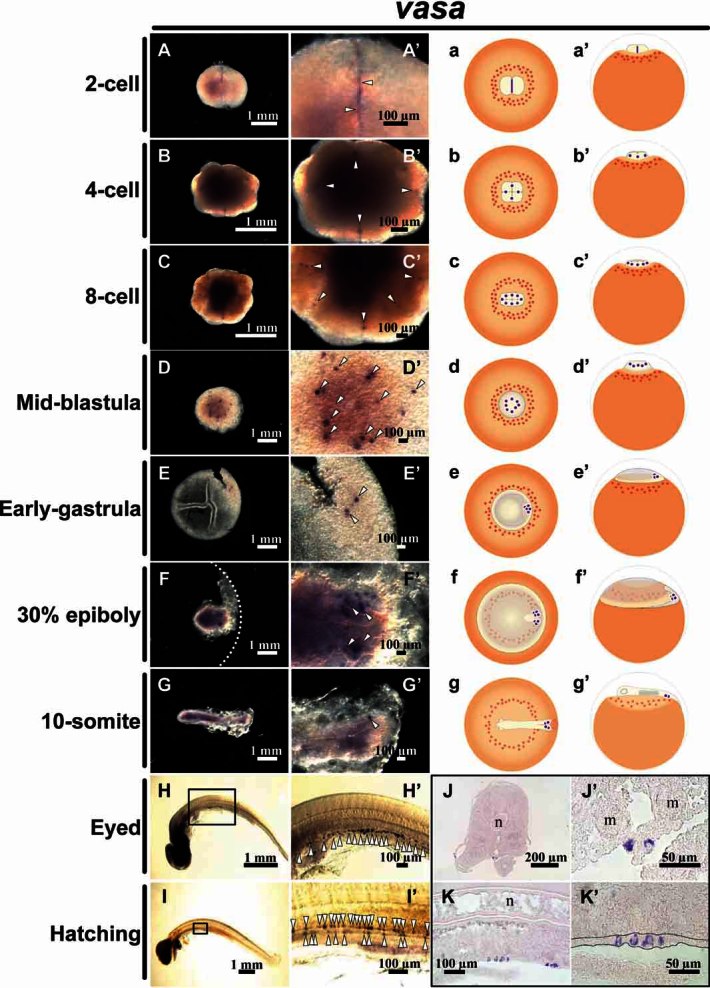
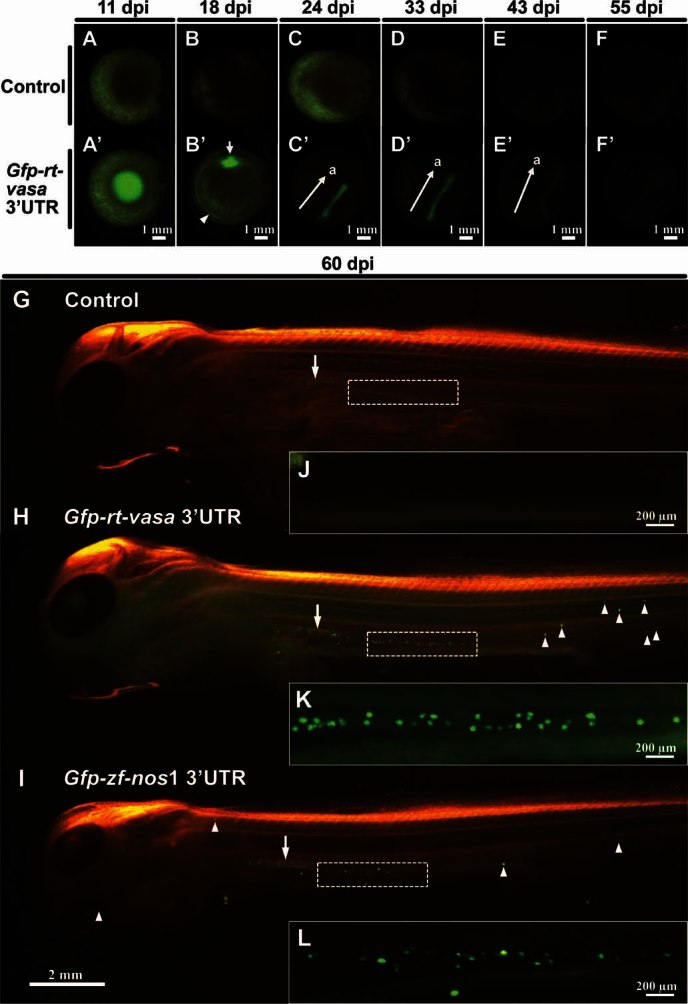
No information exists on the identification of primordial germ cells (PGCs) in the super-order Protacanthopterygii, which includes the Salmonidae family and Atlantic salmon (Salmo salar L.), one of the most commercially important aquatic animals worldwide. In order to identify salmon PGCs, we cloned the full-length cDNA of vasa, dead end (dnd), and lymphocyte antigen 75 (ly75/CD205) genes as germ cell marker candidates, and analyzed their expression patterns in both adult and embryonic stages of Atlantic salmon. Semi-quantitative RT-PCR results showed that salmon vasa and dnd were specifically expressed in testis and ovary, and vasa, dnd, and ly75 mRNA were maternally deposited in the egg. vasa mRNA was consistently detected throughout embryogenesis while dnd and ly75 mRNA were gradually degraded during cleavages. In situ analysis revealed the localization of vasa and dnd mRNA and Ly75 protein in PGCs of hatched larvae. Whole-mount in situ hybridization detected vasa mRNA during embryogenesis, showing a distribution pattern somewhat different to that of zebrafish; specifically, at mid-blastula stage, vasa-expressing cells were randomly distributed at the central part of blastodisc, and then they migrated to the presumptive region of embryonic shield. Therefore, the typical vasa localization pattern of four clusters during blastulation, as found in zebrafish, was not present in Atlantic salmon. In addition, salmon PGCs could be specifically labeled with a green fluorescence protein (GFP) using gfp-rt-vasa 3'-UTR RNA microinjection for further applications. These findings may assist in understanding PGC development not only in Atlantic salmon but also in other salmonids.
Copyright © 2013 Wiley Periodicals, Inc.
Figures
Similar articles
-
Characterization of vasa homolog in a neotropical catfish, Jundiá (Rhamdia quelen): Molecular cloning and expression analysis during embryonic and larval development.Gene. 2018 May 15;654:116-126. doi: 10.1016/j.gene.2018.02.029. Epub 2018 Feb 14. Gene. 2018. PMID: 29454090
-
Expression of vasa and nanos3 during primordial germ cell formation and migration in Atlantic cod (Gadus morhua L.).Theriogenology. 2012 Oct 1;78(6):1262-77. doi: 10.1016/j.theriogenology.2012.05.022. Epub 2012 Aug 13. Theriogenology. 2012. PMID: 22898013
-
Visualizing primordial germ cell migration in embryos of rice field eel (Monopterus albus) using fluorescent protein tagged 3' untranslated regions of nanos3, dead end and vasa.Comp Biochem Physiol B Biochem Mol Biol. 2019 Sep;235:62-69. doi: 10.1016/j.cbpb.2019.06.002. Epub 2019 Jun 6. Comp Biochem Physiol B Biochem Mol Biol. 2019. PMID: 31176867
-
Germ line development in fishes.Int J Dev Biol. 1999;43(7):745-60. Int J Dev Biol. 1999. PMID: 10668983 Review.
-
Dead-end (dnd) protein in fish-a review.Fish Physiol Biochem. 2021 Jun;47(3):777-784. doi: 10.1007/s10695-018-0606-x. Epub 2019 Jan 22. Fish Physiol Biochem. 2021. PMID: 30671782 Review.
Cited by
-
Rescue of germ cells in dnd crispant embryos opens the possibility to produce inherited sterility in Atlantic salmon.Sci Rep. 2020 Oct 22;10(1):18042. doi: 10.1038/s41598-020-74876-2. Sci Rep. 2020. PMID: 33093479 Free PMC article.
-
Characterization of ddx4 and dnd Homologs in Snakeskin Gourami (Trichopodus pectoralis) and Their Expression Levels during Larval Development and in Gonads of Males and Females.Animals (Basel). 2022 Dec 4;12(23):3415. doi: 10.3390/ani12233415. Animals (Basel). 2022. PMID: 36496935 Free PMC article.
-
Primordial Germ Cell Development in the Poeciliid, Gambusia holbrooki, Reveals Shared Features Between Lecithotrophs and Matrotrophs.Front Cell Dev Biol. 2022 Mar 1;10:793498. doi: 10.3389/fcell.2022.793498. eCollection 2022. Front Cell Dev Biol. 2022. PMID: 35300414 Free PMC article.
-
Gene expression in the phenotypically plastic Arctic charr (Salvelinus alpinus): A focus on growth and ossification at early stages of development.Evol Dev. 2019 Jan;21(1):16-30. doi: 10.1111/ede.12275. Epub 2018 Nov 26. Evol Dev. 2019. PMID: 30474913 Free PMC article.
-
Primordial germ cell identification and traceability during the initial development of the Siluriformes fish Pseudopimelodus mangurus.Fish Physiol Biochem. 2022 Oct;48(5):1137-1153. doi: 10.1007/s10695-022-01106-z. Epub 2022 Aug 4. Fish Physiol Biochem. 2022. PMID: 35925505
References
-
- Babiak I, Dabrowski K. Refrigeration of rainbow trout gametes and embryos. J Exp Zool Part A. 2003;300A:140–151. - PubMed
-
- Blazquez M, Gonzalez A, Mylonas CC, Piferrer F. Cloning and sequence analysis of a vasa homolog in the European sea bass (Dicentrarchus labrax): Tissue distribution and mRNA expression levels during early development and sex differentiation. Gen Comp Endocrinol. 2011;170:322–333. - PubMed
-
- Campos C, Valente LMP, Borges P, Bizuayehu T, Fernandes JMO. Dietary lipid levels have a remarkable impact on the expression of growth-related genes in Senegalese sole (Solea senegalensis Kaup) J Exp Biol. 2010;213:200–209. - PubMed
-
- Cao M, Yang Y, Xu H, Duan J, Cheng N, Wang J, Hu W, Zhao H. Germ cell specific expression of Vasa in rare minnow, Gobiocypris rarus. Comp Biochem Physiol A Mol Integr Physiol. 2012;162:163–170. - PubMed
Publication types
MeSH terms
Substances
LinkOut - more resources
Full Text Sources
Other Literature Sources
Molecular Biology Databases
Research Materials
