Mind the gap: racial differences in breast cancer incidence and biologic phenotype, but not stage, among low-income women participating in a government-funded screening program
- PMID: 23239148
- PMCID: PMC3660400
- DOI: 10.1007/s10549-012-2305-0
Mind the gap: racial differences in breast cancer incidence and biologic phenotype, but not stage, among low-income women participating in a government-funded screening program
Abstract
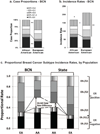
Breast cancer mortality rates in South Carolina (SC) are 40 % higher among African-American (AA) than European-American (EA) women. Proposed reasons include race-associated variations in care and/or tumor characteristics, which may be subject to income effects. We evaluated race-associated differences in tumor biologic phenotype and stage among low-income participants in a government-funded screening program. Best Chance Network (BCN) data were linked with the SC Central Cancer Registry. Characteristics of breast cancers diagnosed in BCN participants aged 47-64 years during 1996-2006 were abstracted. Race-specific case proportions and incidence rates based on estrogen receptor (ER) status and histologic grade were estimated. Among 33,880 low-income women accessing BCN services, repeat breast cancer screening utilization was poor, especially among EAs. Proportionally, stage at diagnosis did not differ by race (607 cancers, 53 % among AAs), with about 40 % advanced stage. Compared to EAs, invasive tumors in AAs were 67 % more likely (proportions) to be of poor-prognosis phenotype (both ER-negative and high-grade); this was more a result of the 46 % lesser AA incidence (rates) of better-prognosis (ER+ lower-grade) cancer than the 32 % greater incidence of poor-prognosis disease (p values <0.01). When compared to the general SC population, racial disparities in poor-prognostic features within the BCN population were attenuated; this was due to more frequent adverse tumor features in EAs rather than improvements for AAs. Among low-income women in SC, closing the breast cancer racial and income mortality gaps will require improved early diagnosis, addressing causes of racial differences in tumor biology, and improved care for cancers of poor-prognosis biology.
Conflict of interest statement
The authors state they have no conflicts of interest.
Figures

References
-
- [Accessed 06/13/12];South Carolina Department of Health and Environmental Control: South Carolina Community Assessment Network. http://scangis.dhec.sc.gov/scan/cancer2/mortinput.aspx.
-
- American Cancer Society. Breast Cancer Facts & Figures 2011–2012. Atlanta: American Cancer Society, Inc; 2011.
-
- Cunningham JE, Butler WM. Racial disparities in female breast cancer in South Carolina: Clinical evidence for a biological basis even in small tumors. Breast Cancer Res Treat. 2004;88:161–176. - PubMed
-
- Cunningham JE, Montero AJ, Garrett-Mayer E, Berkel HJ, Ely B. Racial differences in the incidence of breast cancer subtypes defined by combined histologic grade and hormone receptor status. Cancer Causes Control. 2010;21(3):399–409. Epub 2009 Dec 19. - PubMed
-
- Adams SA, Hebert JR, Bolick-Aldrich S, Daguise VG, Mosley CM, Modayil MV, Berger SH, Teas J, Mitas M, Cunningham JE, Steck SE, Burch J, Butler WM, Horner M-J D, Brandt HM. Breast cancer disparities in South Carolina: Early detection, special programs and descriptive epidemiology. J South Carolina Med Assoc. 2006;102(7):231–239. - PMC - PubMed
Publication types
MeSH terms
Substances
Grants and funding
LinkOut - more resources
Full Text Sources
Medical
Miscellaneous

