. 2013 Jan 25;339(6118):452-6.
doi: 10.1126/science.1232251. Epub 2012 Dec 13.

Actin, spectrin, and associated proteins form a periodic cytoskeletal structure in axons

Affiliations

Actin, spectrin, and associated proteins form a periodic cytoskeletal structure in axons

Ke Xu et al. Science. .

Abstract

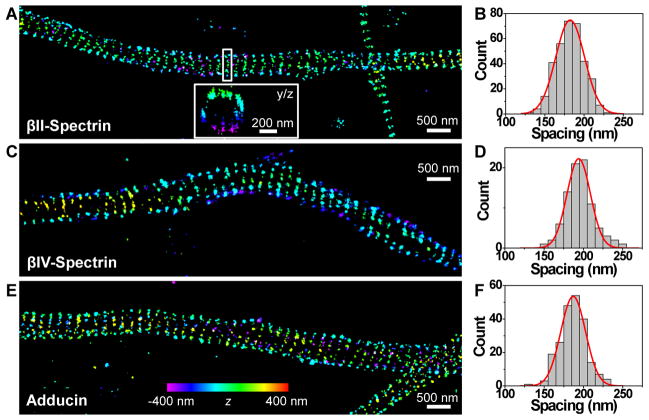
Actin and spectrin play important roles in neurons, but their organization in axons and dendrites remains unclear. We used stochastic optical reconstruction microscopy to study the organization of actin, spectrin, and associated proteins in neurons. Actin formed ringlike structures that wrapped around the circumference of axons and were evenly spaced along axonal shafts with a periodicity of ~180 to 190 nanometers. This periodic structure was not observed in dendrites, which instead contained long actin filaments running along dendritic shafts. Adducin, an actin-capping protein, colocalized with the actin rings. Spectrin exhibited periodic structures alternating with those of actin and adducin, and the distance between adjacent actin-adducin rings was comparable to the length of a spectrin tetramer. Sodium channels in axons were distributed in a periodic pattern coordinated with the underlying actin-spectrin-based cytoskeleton.


Figures

Fig. 1
Fig. 1
STORM imaging reveals distinct organization of actin filaments in the axons and dendrites of neurons. (A) Conventional fluorescence image of actin (green) and a dendritic marker, MAP2 (magenta), in a cultured hippocampal neuron fixed at 7 DIV. (B) 3D STORM image of actin in a dendritic region corresponding to the white box in (A). The z-positions in the STORM image are color-coded according to the color scale, with violet and red indicating positions closest to and farthest from the substratum, respectively. (C) Magnification of the region inside the red box in (B). The yz cross-section corresponding to the white-boxed region is shown in the inset. (D) Conventional fluorescence image of actin (green) and MAP2 (magenta) in a neuron fixed at 12 DIV. (E) 3D STORM image of actin in a region containing axons (devoid of the dendritic marker MAP2), corresponding to the yellow box in (D). The yz cross-sections corresponding to the white-boxed regions are shown in the insets. The 3D STORM image of a region containing a dendrite of this neuron is shown in Fig. S1B (28). (F) Conventional fluorescence image of actin (green) and an axon initial segment marker, NrCAM (magenta), in a neuron fixed at 9 DIV. (G) 3D STORM image of actin in a region containing the axon initial segments, corresponding to the dashed yellow box in (D).
Fig. 2
Fig. 2
Actin filaments in axons form a quasi-1D, periodic structure with a uniform spacing of ~180–190 nm. (A) 3D STORM image of a segment of axon (upper panel) and the distribution of localized molecules after the 3D image was projected to one dimension along the axon long axis (lower panel). (B) Fourier transform of the 1D localization distribution shown in (A). The Fourier transform shows a fundamental frequency of (190 nm)−1 and an overtone. (C) Histogram of the spacings between adjacent actin ring-like structures (N = 204). The red line is a Gaussian fit with mean = 182 nm and standard deviation = 16 nm.
Fig. 3
Fig. 3
Spectrin and adducin exhibit quasi-1D, periodic patterns in axons, quantitatively similar to that observed for actin. (A) 3D STORM image of βII-spectrin in axons. βII-spectrin is immunostained against its C-terminal region, which is situated at the center of the rod-like αII-βII spectrin tetramer. Inset: the yz cross-section of the boxed region showing the ring-like structure. (B) Histogram of the spacings between adjacent spectrin rings (N = 340). The red line is a Gaussian fit with mean = 182 nm and standard deviation = 18 nm. (C, D) Same as (A, B) but for βIV-spectrin, which is specifically located in the initial segments of axons. βIV-spectrin is immunostained against its N-terminal region, which corresponds to the ends of the spectrin tetramer. The red line superimposed on the histogram is a Gaussian fit with mean = 194 nm and standard deviation = 15 nm (N = 88). (E, F) Same as (A, B) but for adducin, an actin-capping protein. The red line superimposed on the histogram is a Gaussian fit with mean = 187 nm and standard deviation = 16 nm (N = 216).
Fig. 4
Fig. 4
Actin, spectrin, and adducin form a coordinated, quasi-1D lattice structure in axons, and sodium channels are distributed in a periodic pattern in coordination with the actin-spectrin-based submembrane cytoskeleton. (A) Two-color, STORM image of actin (green) and βII-spectrin (magenta). βII-spectrin is immunostained against its C-terminal region, which is situated at the center of the spectrin tetramer. (B) Two-color, STORM image of actin (green) and adducin (magenta). (C) Two-color, STORM image of βII-spectrin (green) and adducin (magenta). (D) Two-color, STORM image of sodium channels (Nav, green) and βIV-spectrin (magenta). βIV-spectrin is immunostained against its N-terminal region, which is situated at the two ends of the spectrin tetramer. The distributions of the localized molecules along the axon shafts are shown in Fig. S9 (28). (E) Spatial correlations between actin and βII-spectrin C-terminus (A, black), between actin and adducin (B, blue), between adducin and βII-spectrin C-terminus (C, red), and between sodium channels and βIV-spectrin N-terminus (D, green). The correlation function is calculated for varying relative shifts between the two color channels along the axons. (F) A model for the cortical cytoskeleton in axons. Short actin filaments (green), capped by adducin (blue) at one end, form ring-like structures wrapping around the circumference of the axon. Spectrin tetramers (magenta) connect the adjacent actin/adducin rings along the axon, creating a quasi-1D lattice structure with a periodicity of ~180–190 nm. The letters “C” and “N” in the legend mark the C-terminus (magenta triangle) and N-terminus of β-spectrin (magenta square), respectively. Ankyrin and sodium channels, not shown in the model, also form semi-periodic patterns in coordination with the periodic cytoskeletal structure.

Comment in

References

    1. Pollard TD, Cooper JA. Science. 2009;326:1208. - PMC - PubMed
    1. Dent EW, Gertler FB. Neuron. 2003;40:209. - PubMed
    1. Cingolani LA, Goda Y. Nat Rev Neurosci. 2008;9:344. - PubMed
    1. Kapitein LC, Hoogenraad CC. Mol Cell Neurosci. 2011;46:9. - PubMed
    1. Lewis AK, Bridgman PC. J Cell Biol. 1992;119:1219. - PMC - PubMed

Publication types

MeSH terms