

Adenosine deaminase enhances the immunogenicity of human dendritic cells from healthy and HIV-infected individuals
- PMID: 23240012
- PMCID: PMC3519778
- DOI: 10.1371/journal.pone.0051287
Adenosine deaminase enhances the immunogenicity of human dendritic cells from healthy and HIV-infected individuals
Abstract
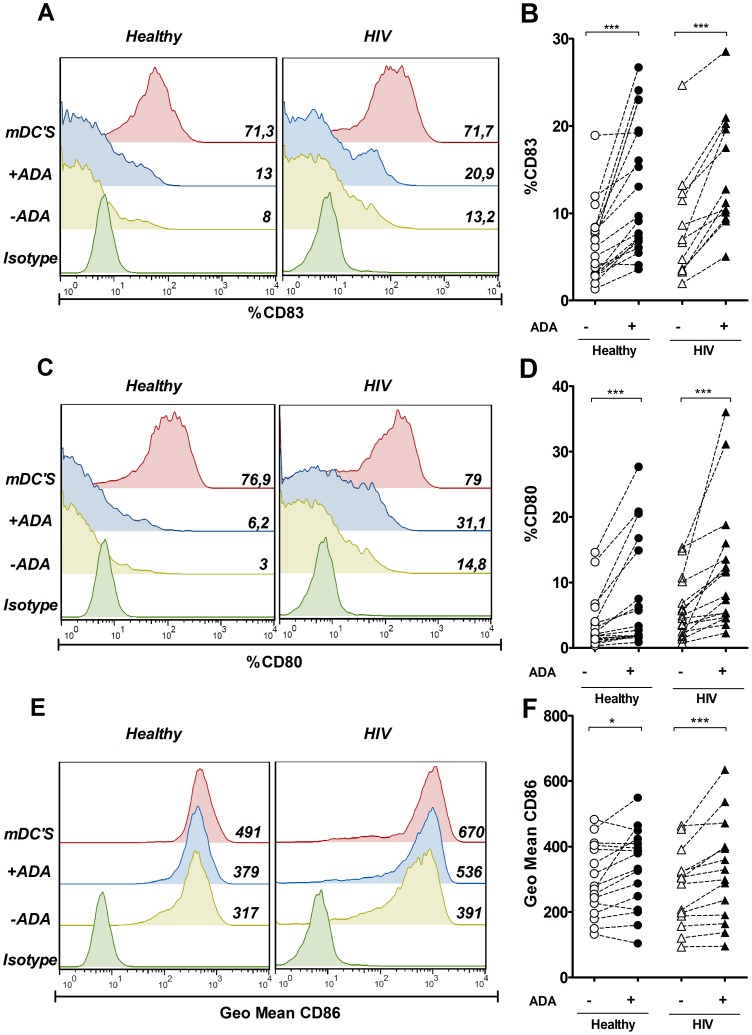
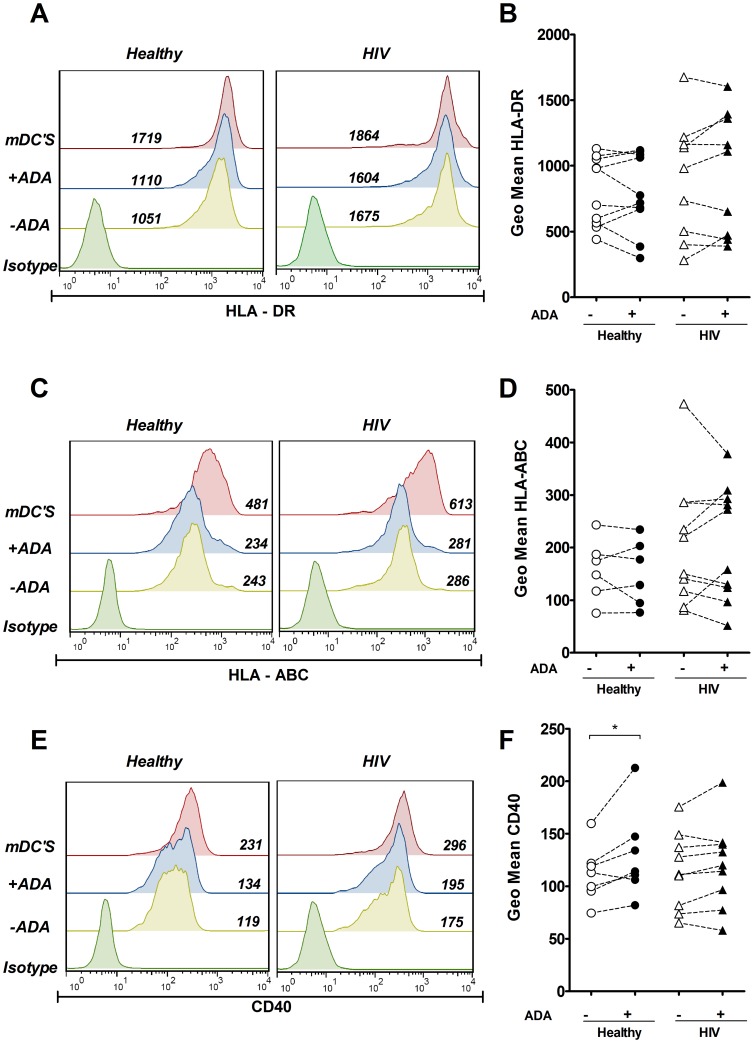
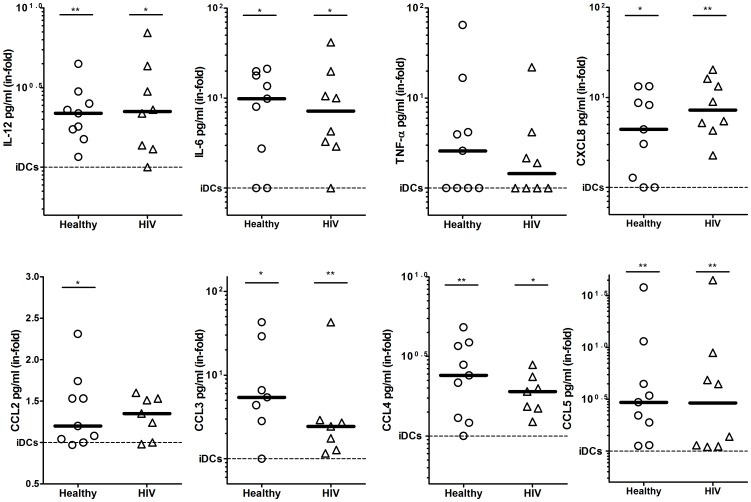
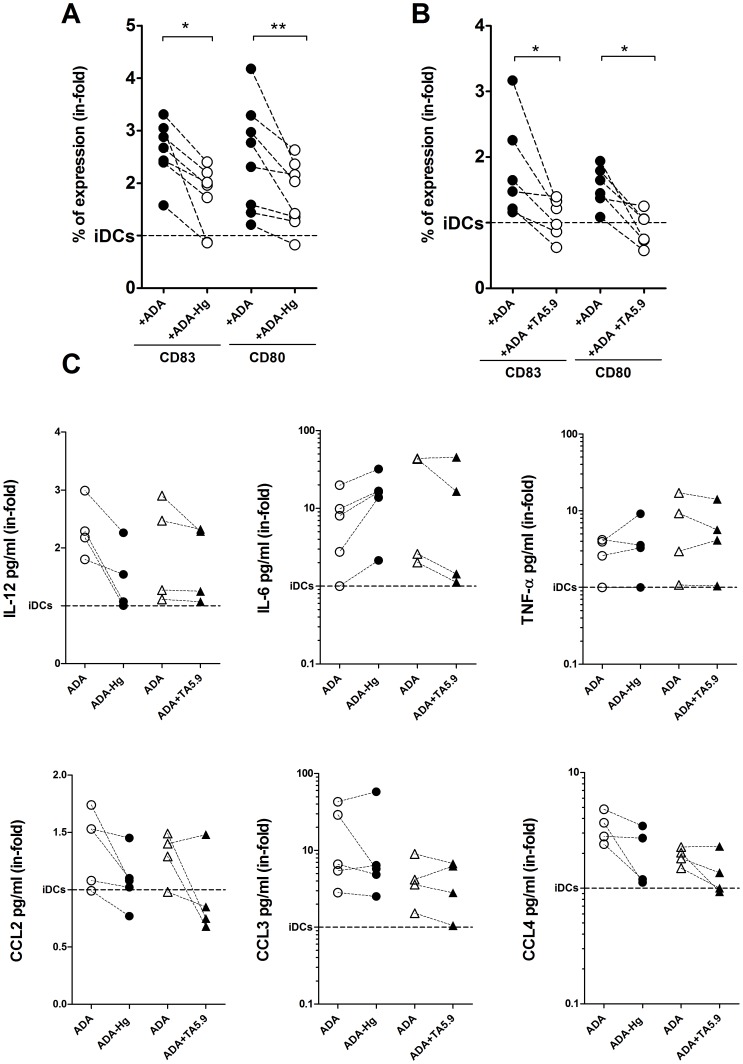
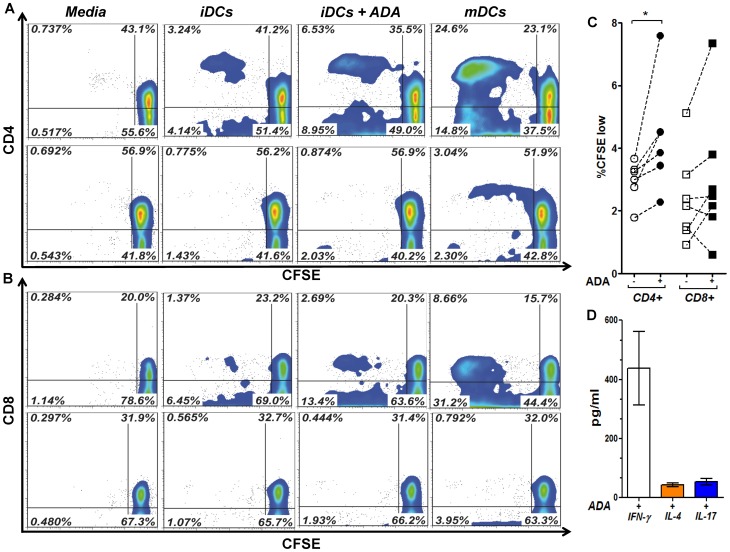
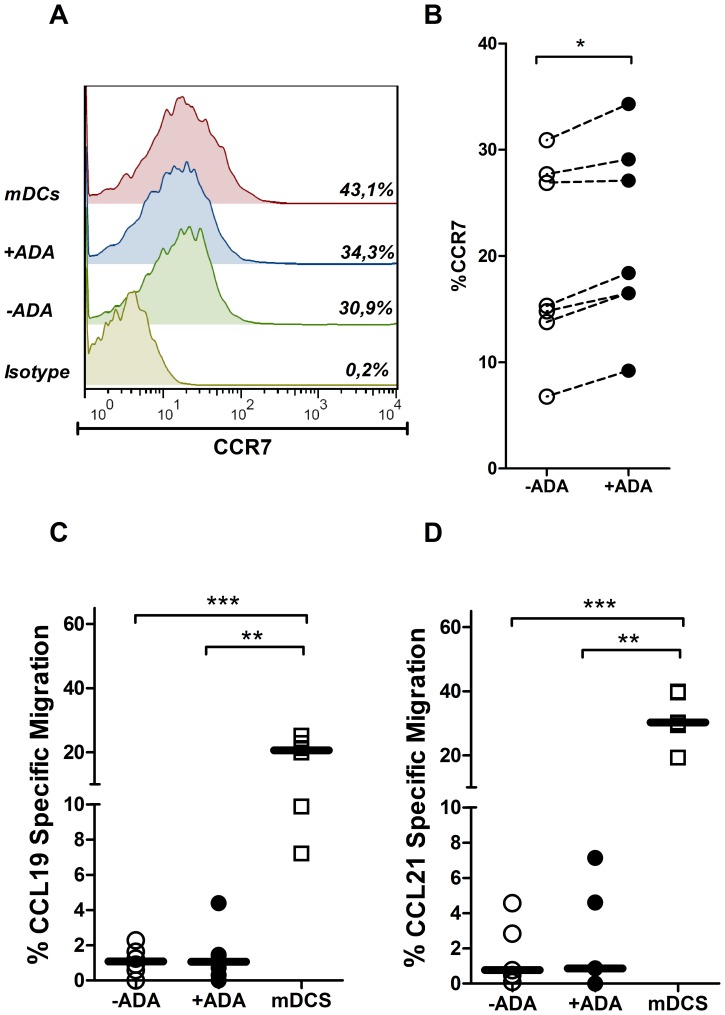
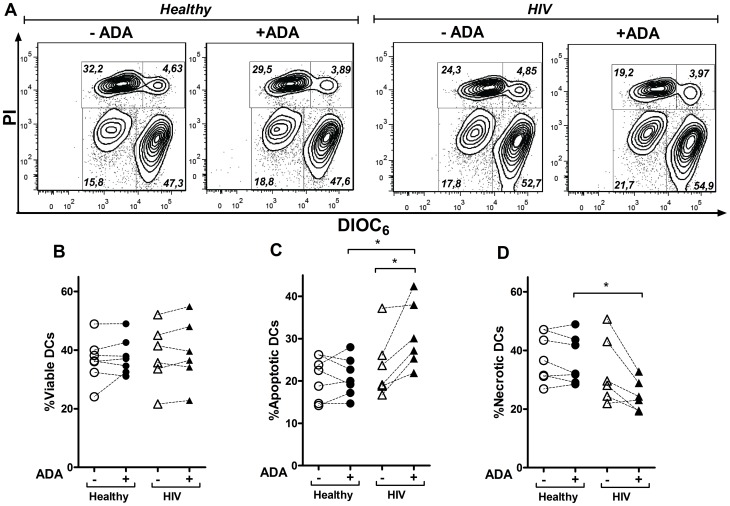
ADA is an enzyme implicated in purine metabolism, and is critical to ensure normal immune function. Its congenital deficit leads to severe combined immunodeficiency (SCID). ADA binding to adenosine receptors on dendritic cell surface enables T-cell costimulation through CD26 crosslinking, which enhances T-cell activation and proliferation. Despite a large body of work on the actions of the ecto-enzyme ADA on T-cell activation, questions arise on whether ADA can also modulate dendritic cell maturation. To this end we investigated the effects of ADA on human monocyte derived dendritic cell biology. Our results show that both the enzymatic and non-enzymatic activities of ADA are implicated in the enhancement of CD80, CD83, CD86, CD40 and CCR7 expression on immature dendritic cells from healthy and HIV-infected individuals. These ADA-mediated increases in CD83 and costimulatory molecule expression is concomitant to an enhanced IL-12, IL-6, TNF-α, CXCL8(IL-8), CCL3(MIP1-α), CCL4(MIP-1β) and CCL5(RANTES) cytokine/chemokine secretion both in healthy and HIV-infected individuals and to an altered apoptotic death in cells from HIV-infected individuals. Consistently, ADA-mediated actions on iDCs are able to enhance allogeneic CD4 and CD8-T-cell proliferation, globally yielding increased iDC immunogenicity. Taken together, these findings suggest that ADA would promote enhanced and correctly polarized T-cell responses in strategies targeting asymptomatic HIV-infected individuals.
Conflict of interest statement
Figures
Similar articles
-
Immunological dysfunction in HIV-1-infected individuals caused by impairment of adenosine deaminase-induced costimulation of T-cell activation.Immunology. 2009 Nov;128(3):393-404. doi: 10.1111/j.1365-2567.2009.03121.x. Immunology. 2009. PMID: 20067539 Free PMC article.
-
Adenosine deaminase regulates Treg expression in autologous T cell-dendritic cell cocultures from patients infected with HIV-1.J Leukoc Biol. 2016 Feb;99(2):349-59. doi: 10.1189/jlb.3A1214-580RR. Epub 2015 Aug 26. J Leukoc Biol. 2016. PMID: 26310829
-
Dendritic cells exposed to MVA-based HIV-1 vaccine induce highly functional HIV-1-specific CD8(+) T cell responses in HIV-1-infected individuals.PLoS One. 2011;6(5):e19644. doi: 10.1371/journal.pone.0019644. Epub 2011 May 18. PLoS One. 2011. PMID: 21625608 Free PMC article.
-
[Adenosine deaminase as costimulatory molecule and marker of cellular immunity].Invest Clin. 2010 Dec;51(4):561-71. Invest Clin. 2010. PMID: 21365880 Review. Spanish.
-
Adenosine and Adenosine Deaminase Contrary Manifestations in Immunity.Scand J Immunol. 2025 Jul;102(1):e70038. doi: 10.1111/sji.70038. Scand J Immunol. 2025. PMID: 40572058 Review.
Cited by
-
Adenosine signaling and adenosine deaminase regulation of immune responses: impact on the immunopathogenesis of HIV infection.Purinergic Signal. 2018 Dec;14(4):309-320. doi: 10.1007/s11302-018-9619-2. Epub 2018 Aug 10. Purinergic Signal. 2018. PMID: 30097807 Free PMC article. Review.
-
Review of T cell proliferation regulatory factors in treatment and prognostic prediction for solid tumors.Heliyon. 2023 Oct 29;9(11):e21329. doi: 10.1016/j.heliyon.2023.e21329. eCollection 2023 Nov. Heliyon. 2023. PMID: 37954355 Free PMC article. Review.
-
Purinergic signaling and human immunodeficiency virus/acquired immune deficiency syndrome: From viral entry to therapy.World J Virol. 2015 Aug 12;4(3):285-94. doi: 10.5501/wjv.v4.i3.285. World J Virol. 2015. PMID: 26279989 Free PMC article. Review.
-
Dendritic cell based vaccines for HIV infection: the way ahead.Hum Vaccin Immunother. 2013 Nov;9(11):2445-52. doi: 10.4161/hv.25876. Epub 2013 Aug 2. Hum Vaccin Immunother. 2013. PMID: 23912672 Free PMC article. Review.
-
Purinergic modulation of the immune response to infections.Purinergic Signal. 2022 Mar;18(1):93-113. doi: 10.1007/s11302-021-09838-y. Epub 2022 Jan 8. Purinergic Signal. 2022. PMID: 34997903 Free PMC article. Review.
References
-
- Gaspar HB, Aiuti A, Porta F, Candotti F, Hershfield MS, et al. (2009) How I treat ADA deficiency. Blood 114: 3524–3532 doi:10.1182/blood-2009-06-189209. - DOI - PMC - PubMed
-
- Blackburn MR, Thompson LF (2012) Adenosine Deaminase Deficiency: Unanticipated Benefits from the Study of a Rare Immunodeficiency. J Immunol 188: 933–935 doi:10.4049/jimmunol.1103519. - DOI - PMC - PubMed
-
- Arredondo-Vega FX, Santisteban I, Daniels S, Toutain S, Hershfield MS (1998) Adenosine deaminase deficiency: genotype-phenotype correlations based on expressed activity of 29 mutant alleles. Am J Hum Genet 63: 1049–1059 doi:10.1086/302054. - DOI - PMC - PubMed
-
- Cassani B, Mirolo M, Cattaneo F, Benninghoff U, Hershfield M, et al. (2008) Altered intracellular and extracellular signaling leads to impaired T-cell functions in ADA-SCID patients. Blood 111: 4209–4219 doi:10.1182/blood-2007-05-092429. - DOI - PMC - PubMed
-
- Kameoka J, Tanaka T, Nojima Y, Schlossman SF, Morimoto C (1993) Direct association of adenosine deaminase with a T cell activation antigen, CD26. Science 261: 466–469. - PubMed
Publication types
MeSH terms
Substances
LinkOut - more resources
Full Text Sources
Other Literature Sources
Medical
Molecular Biology Databases
Research Materials
Miscellaneous
