. 2012;7(12):e51499.
doi: 10.1371/journal.pone.0051499. Epub 2012 Dec 11.

Development of polydimethylsiloxane substrates with tunable elastic modulus to study cell mechanobiology in muscle and nerve

Affiliations

Development of polydimethylsiloxane substrates with tunable elastic modulus to study cell mechanobiology in muscle and nerve

Rachelle N Palchesko et al. PLoS One. 2012.

Abstract

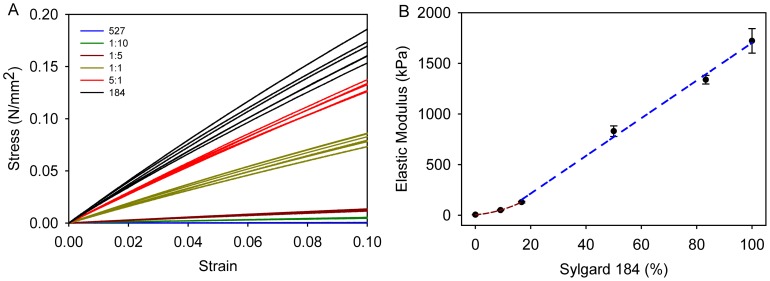
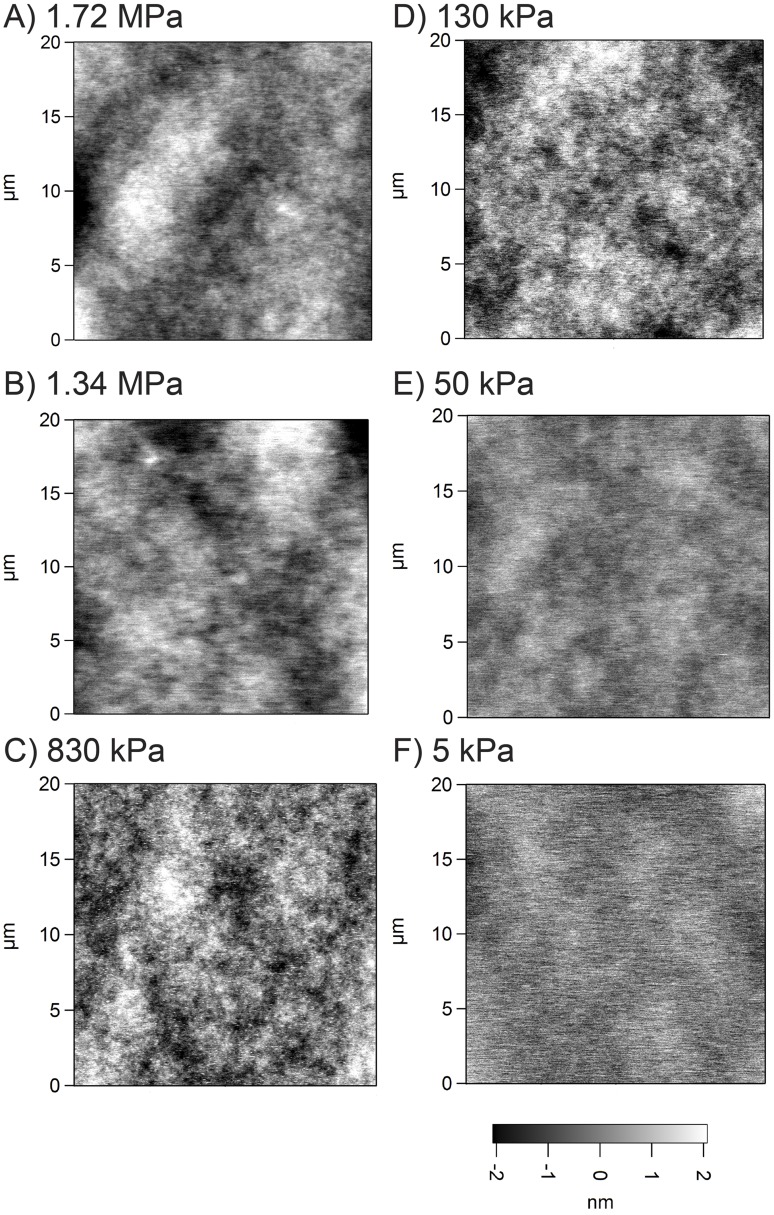
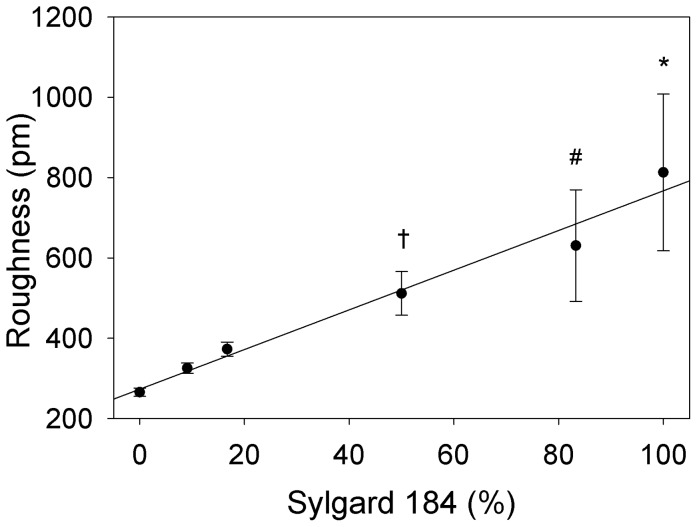
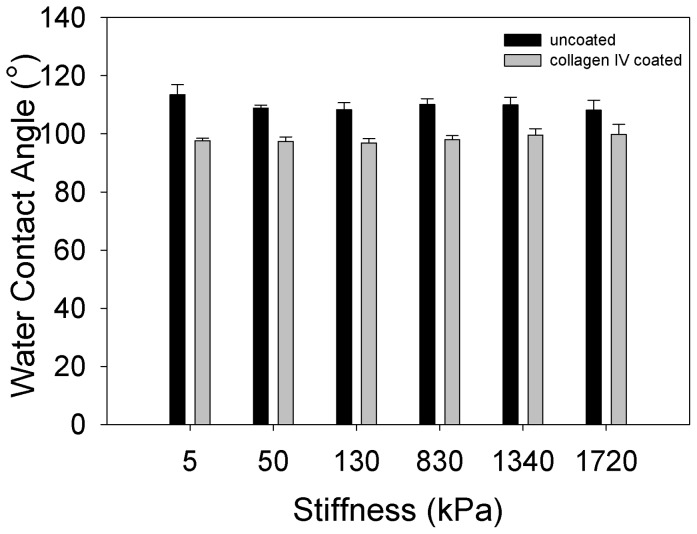
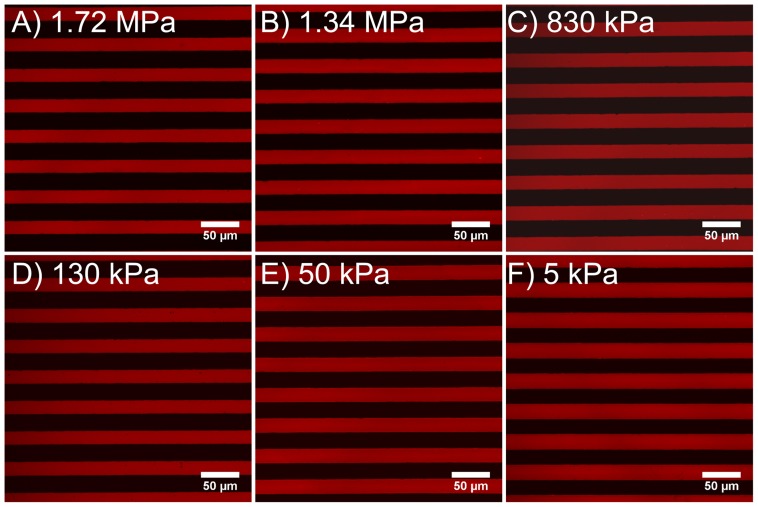
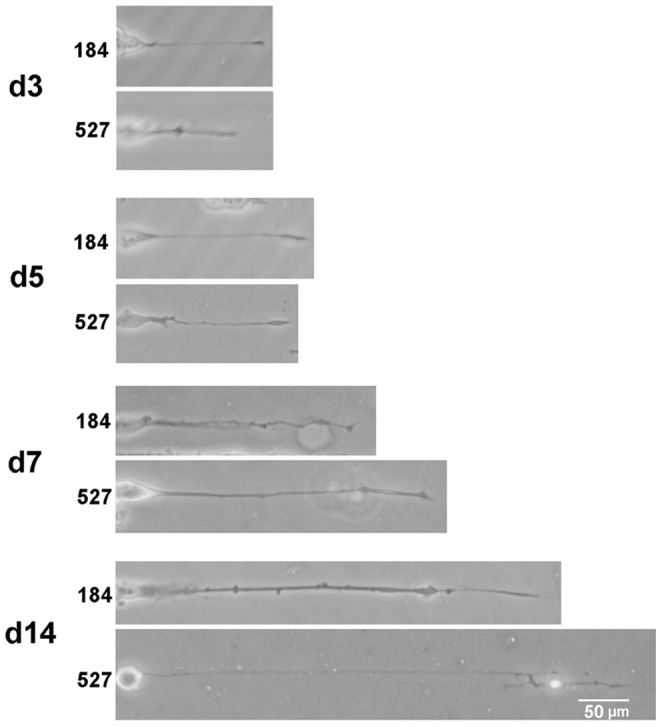
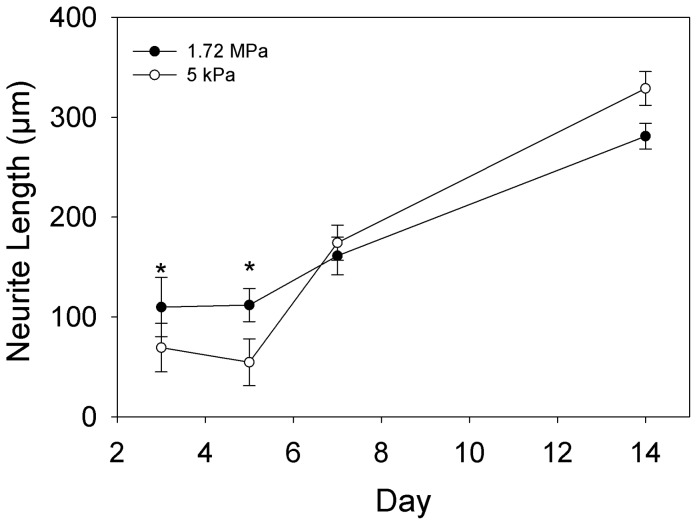
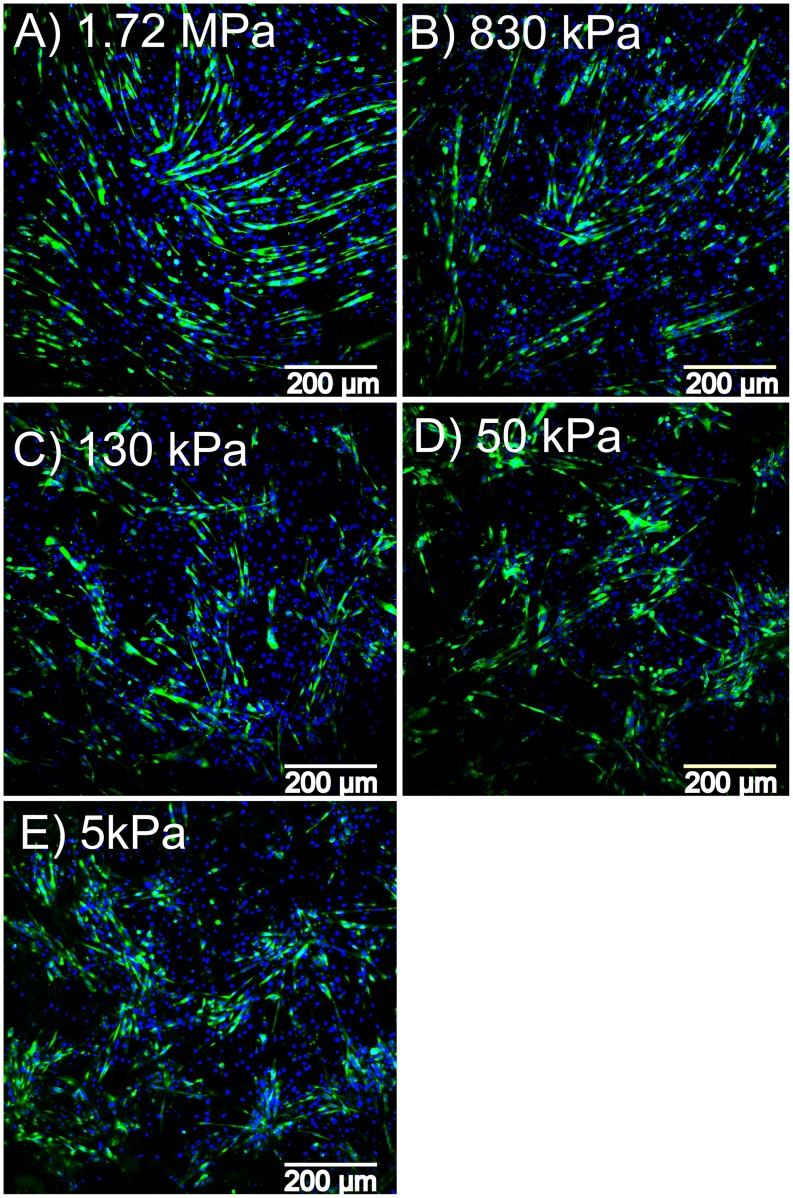
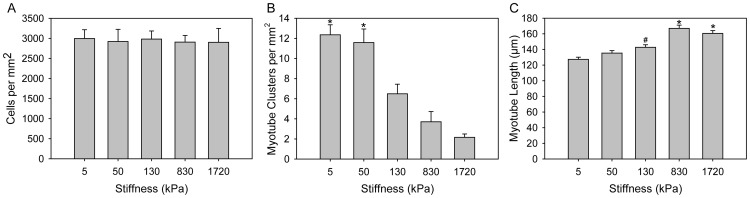
Mechanics is an important component in the regulation of cell shape, proliferation, migration and differentiation during normal homeostasis and disease states. Biomaterials that match the elastic modulus of soft tissues have been effective for studying this cell mechanobiology, but improvements are needed in order to investigate a wider range of physicochemical properties in a controlled manner. We hypothesized that polydimethylsiloxane (PDMS) blends could be used as the basis of a tunable system where the elastic modulus could be adjusted to match most types of soft tissue. To test this we formulated blends of two commercially available PDMS types, Sylgard 527 and Sylgard 184, which enabled us to fabricate substrates with an elastic modulus anywhere from 5 kPa up to 1.72 MPa. This is a three order-of-magnitude range of tunability, exceeding what is possible with other hydrogel and PDMS systems. Uniquely, the elastic modulus can be controlled independently of other materials properties including surface roughness, surface energy and the ability to functionalize the surface by protein adsorption and microcontact printing. For biological validation, PC12 (neuronal inducible-pheochromocytoma cell line) and C2C12 (muscle cell line) were used to demonstrate that these PDMS formulations support cell attachment and growth and that these substrates can be used to probe the mechanosensitivity of various cellular processes including neurite extension and muscle differentiation.


Conflict of interest statement

Competing Interests: The authors have declared that no competing interests exist.

Figures

Figure 1
Figure 1. PDMS formulations span a wide range of mechanical properties from soft gels to stiff elastomers.
(A) Stress strain curves for the six different PDMS formulations show that the curves for each type (n = 6) are clustered and separated from the curves of the other formulations. Over a 10% strain all formulations are linearly elastic. (B) Elastic modulus of the six different PDMS formulations as a function of weight percent Sylgard 184. The elastic modulus of each formulation is significantly different from the other PDMS formulations (One-way ANOVA, p<0.05). The curves predict that PDMS formulations can be fabricated with elastic moduli anywhere in the range from 5 kPa to 1.72 MPa by fine tuning the percentage of Sylgard 184 mixed in with the Sylgard 527. We have separated the data into two regimes, a non-linear regime for low percentages of Sylgard 184 (red curve) and a linear regime for larger percentages of Sylgard 184 (blue curve). The equation for the red curve is y = 0.3236x2+2.0606x +5 (R2 = 1). The equation for the blue curve is y = 18.591x–156.87 (R2 = 0.995). Data represented as mean ± standard deviation.
Figure 2
Figure 2. Representative AFM scans of the surface topography for the different PDMS formulations.
These images show that all PDMS formulations have similar morphological appearance and total variation in height of ∼4 nm over a 20 µm scan area. The different scans are for (A) 1.72 MPa, (B) 1.34 MPa, (C) 830 kPa, (D) 130 kPa, (E) 50 kPa and (F) 5 kPa elastic modulus PDMS formulations.
Figure 3
Figure 3. RMS roughness of the six PDMS formulations as a function of weight percent Sylgard 184.
As the percentage of Sylgard 184 increases, the RMS roughness also increases, ranging from approximately 200 to 800 pm. While there are significant difference in roughness between formulations, all have an RMS roughness of <1 nm, smaller than what cells can typically differentiate. Thus, we consider all the PDMS formulations to have equivalent surface roughness in terms of what a cell can sense and respond to. The relationship between RMS roughness and weight percent Sylgard 184 is fit by a linear regression (solid line, y = 273.25 + 4.94x, R2 = 0.9745). Data represented as mean ± standard deviation, statistical significance determined by one-way ANOVA on the ranks with Tukey post hoc test (n = 9) where (*) was significantly different from 0, 9.09 and 16.67%, (#) was significantly different from 0 and 9.90% and (†) was significantly different from 0% Sylgard 184 formulations (p<0.05).
Figure 4
Figure 4. Water contact angle of uncoated and collagen IV coated PDMS formulations.
The water contact angles of all uncoated PDMS formulations (black) are approximately 110°, indicating a similar surface energy and hydrophobicity. The water contact angles of all PDMS formulations decreases to approximately 100° when coated with collagen type IV (gray), indicating similar protein adsorption behavior and surface energy. All uncoated PDMS formulations were relatively hydrophobic thought to be indistinguishable to cells despite the small, but statistically significant differences in water contact angle between the 5 kPa versus the 1.72 MPa, 130 kPa and 50 kPa substrates (# indicates p<0.05). All collagen type IV coated PDMS formulations were statistically equivalent and had statistically significant decreases in water contact angle compared to the uncoated PDMS (*indicates p<0.05). Data represented as mean ± standard deviation, statistical significance based on two-way ANOVA with Holm-Sidak pairwise comparison (n = 6).
Figure 5
Figure 5. Representative examples of fluorescently labeled fibronectin micropatterned on the different PDMS formulations.
The protein pattern is transferred with high fidelity on all the PDMS formulations indicating the substrates exhibit similar protein adsorption from the PDMS stamps (made from Sylgard 184) used for microcontact printing. The different images are for (A) 1.72 MPa, (B) 1.34 MPa, (C) 830 kPa, (D) 130 kPa, (E) 50 kPa and (F) 5 kPa elastic modulus PDMS formulations. Scale bars are 50 µm.
Figure 6
Figure 6. Representative phase contrast images show single neurites extending from the cell body of PC12 cells.
The PC12 cells were differentiated into neuron-like cells and cultured on 5 kPa and 1.72 MPa PDMS (Sylgard 527 and Sylgard 184, respectively). Laminin was micropatterned as 20 µm wide, 20 µm spaced lines to direct the linear extension of neurites, which were imaged at 3, 5 7 and 14 days. The neuron length increased with culture time and was qualitatively similar between the two PDMS types. Scale bar is 50 µm.
Figure 7
Figure 7. Quantification of neurite length for PC12 cells cultured on two different PDMS formulations.
PC12 cells were cultured on 1.72 MPa (•, black circles) and 5 kPa (○, white circles) PDMS and evaluated at days 3, 5, 7 and 14. At days 3 and 5, neurite length on 1.72 MPa PDMS was significantly greater compared to neurite length on 5 kPa PDMS. On days 7 and 14 the neurite length was equivalent on both PDMS types. This suggests that PC12 neurites initially grow faster on stiffer PDMS substrates (up to 5 days), but by 7 days the growth rate has slowed on the stiffer PDMS and accelerated on the softer PDMS such that neurite lengths are equivalent. Data represented as mean ± standard error of the mean. Statistical significance at each time point determined by a Mann-Whitney Rank Sum Test, *indicates p≤0.001.
Figure 8
Figure 8. Representative fluorescent images of C2C12 cells differentiated into myotubes on different PDMS formulations.
C2C12 cells cultured and differentiated on PDMS (A) 1.72MPa, (B) 830 kPa, (C) 130 kPa, (D) 50 kPa and (E) 5 kPa formulations. All cells were stained for the nucleus with DAPI (blue) and differentiated myotubes were stained for myosin heavy chain (green). Cells cultured on the stiffer PDMS substrates (A–C) formed longer myotubes, whereas cells cultured on the softer substrates (D and E) formed shorter myotubes and tended to organize into cell clusters. Scale bars are 200 µm.
Figure 9
Figure 9. Quantification of cell density, myotube length and myotube clustering performed as a function of the PDMS elastic modulus.
(A) Average cell density of the different PDMS formulations shows no difference as a function of substrate elastic modulus. (B) Average number of myotube clusters per mm2 on the different PDMS formulations (n = 9). The cells cultured on the 5 and 50 kPa substrates formed significantly more myotube clusters compared to the other substrates (*indicates p<0.001). (C) Average length of myosin heavy chain positive myotubes on the different PDMS formulations (5 kPa, n = 706; 50 kPa, n = 739; 130 kPa, n = 662; 830 kPa, n = 769; 1.72 MPa, n = 760). Cells cultured on the stiffer 1.72 MPa and 830 kPa substrates formed significantly longer myotubes compared to those formed on the softer 130, 50 and 5 kPa substrates (*indicates p<0.001). Cells cultured on the 130 kPa substrate also formed longer myotubes compared to those formed on the 5 kPa substrate (# indicates p<0.001). Data represented as mean ± standard error of the mean, statistical analysis by Kruskal Wallis ANOVA on the ranks with p<0.05 Dunn’s method for pairwise comparison.

References

    1. Engler AJ, Sen S, Sweeney HL, Discher DE (2006) Matrix elasticity directs stem cell lineage specification. Cell 126: 677–689. - PubMed
    1. Pelham RJ Jr, Wang Y (1997) Cell locomotion and focal adhesions are regulated by substrate flexibility. Proc Natl Acad Sci U S A 94: 13661–13665. - PMC - PubMed
    1. Discher DE, Janmey P, Wang YL (2005) Tissue cells feel and respond to the stiffness of their substrate. Science 310: 1139–1143. - PubMed
    1. Discher DE, Engler A, Carag C, Rehfeldt F (2008) Matrix elasticity effects on cardiomyocytes and stem cells: Similarities, differences and therapeutic implications. Biorheology 45: 54–54.
    1. Engler AJ, Carag-Krieger C, Johnson CP, Raab M, Tang HY, et al. (2008) Embryonic cardiomyocytes beat best on a matrix with heart-like elasticity: scar-like rigidity inhibits beating. Journal of Cell Science 121: 3794–3802. - PMC - PubMed

Publication types