. 2012;7(12):e51508.
doi: 10.1371/journal.pone.0051508. Epub 2012 Dec 11.

A systems approach to rheumatoid arthritis

Affiliations

A systems approach to rheumatoid arthritis

Sungyong You et al. PLoS One. 2012.

Abstract

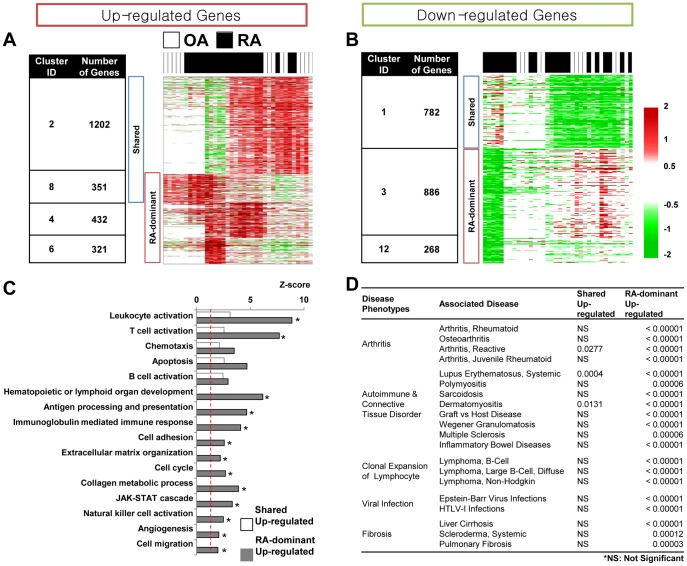
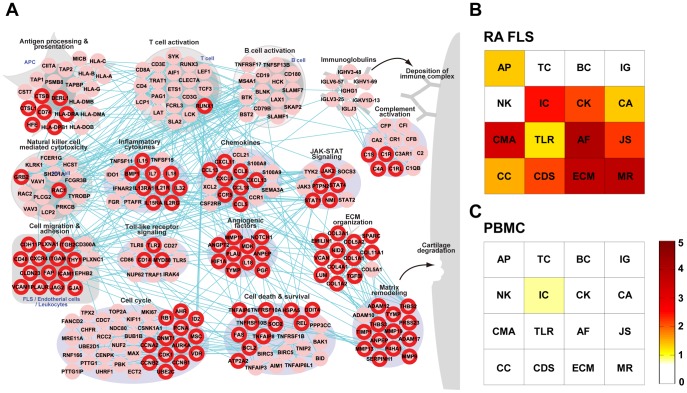
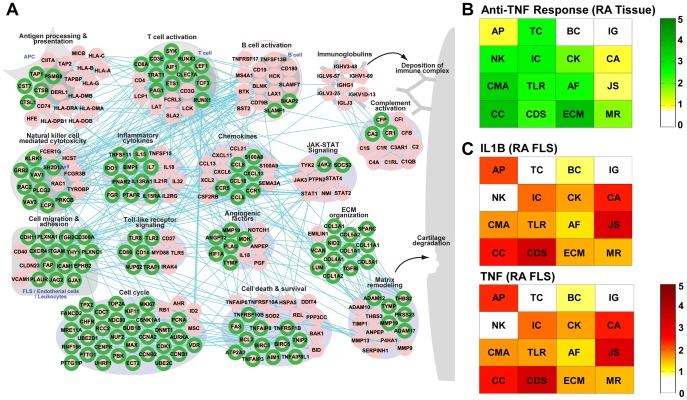
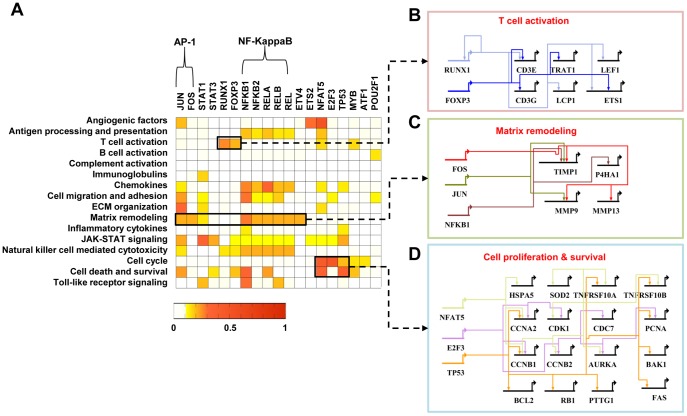
Rheumatoid arthritis (RA) is a chronic autoimmune disease that primarily attacks synovial joints. Despite the advances in diagnosis and treatment of RA, novel molecular targets are still needed to improve the accuracy of diagnosis and the therapeutic outcomes. Here, we present a systems approach that can effectively 1) identify core RA-associated genes (RAGs), 2) reconstruct RA-perturbed networks, and 3) select potential targets for diagnosis and treatments of RA. By integrating multiple gene expression datasets previously reported, we first identified 983 core RAGs that show RA dominant differential expression, compared to osteoarthritis (OA), in the multiple datasets. Using the core RAGs, we then reconstructed RA-perturbed networks that delineate key RA associated cellular processes and transcriptional regulation. The networks revealed that synovial fibroblasts play major roles in defining RA-perturbed processes, anti-TNF-α therapy restored many RA-perturbed processes, and 19 transcription factors (TFs) have major contribution to deregulation of the core RAGs in the RA-perturbed networks. Finally, we selected a list of potential molecular targets that can act as metrics or modulators of the RA-perturbed networks. Therefore, these network models identify a panel of potential targets that will serve as an important resource for the discovery of therapeutic targets and diagnostic markers, as well as providing novel insights into RA pathogenesis.


Conflict of interest statement

Competing Interests: The authors have declared that no competing interests exist.

Figures

Figure 1
Figure 1. RA associated genes, cellular processes and disease phenotypes.
A) and B) Seven major clusters (1, 2, 3, 4, 6, 8, 12) showing the DEPs of the RAGs in RA and OA samples: Shared (shared RAGs commonly up- or down-regulated in RA and OA samples; RA-dominant (RAGs dominantly up- or down-regulated in RA samples). The number of RAGs in each cluster is denoted in the table. When a gene shows a mixture of the DEPs in the multiple clusters, NMF, as a soft clustering method, assigns the gene to multiple clusters. Thus, the summation of the RA-dominant up-regulated RAGs (1104 RAGs) could be larger than 983 presented as the number of the RA-dominant RAGs. C) GO Biological Processes (GOBPs) enriched by the up-regulated RAGs (P<0.05). For each GOBP, a Z score was computed by N −1(1-P) where N −1(−) is the inverse of a standard normal cumulative density function and P is the enrichment p-value for the GOBP. Empty and gray bars represent the GOBPs enriched by shared and RA-dominant up-regulated RAGs, respectively. D) Five classes of RA-related diseases and their association with the RAGs. P-values were computed using the empirical statistical testing described in supplementary methods).
Figure 2
Figure 2. A RA-perturbed network in the RA synovium and signatures of FLS and PBMC in the RA tissue network.
A) A RA-perturbed network describing RA associated cellular processes in which 242 up-regulated RAGs are involved and their interactions. The network nodes are arranged into sixteen modules based on their GOBPs and the KEGG pathways that they belong to. The nodes with red boundary represent DEGs in RA FLS. B) and C) Module enrichment scores (see text for definition) representing the significances of overlaps of the DEGs in RA FLS (B) or PBMC (C) with the genes belonging to the sixteen network modules. See text for detailed discussion. AP = Antigen processing & presentation; TC = T-cell activation; BC = B-cell activation; IG = Immunoglobulins; CA = Complement activation; NK = Natural killer cell mediated cytotoxicity; IC = Inflammatory cytokines; CK = Chemokines; CMH = Cell migration & adhesion; TLR = Toll-like receptor signaling; AF = Angiogenic factors; JS = JAK-STAT signaling; CC = Cell cycle & DNA repair; CDS = Cell death & survival; ECM = ECM organization; MR = Matrix remodeling.
Figure 3
Figure 3. Signatures of anti-TNF inhibitors in RA-perturbed network.
A) A RA-perturbed networks showing the recovery of the elevated RAGs to normality by anti-TNF therapy. Green border colors represent the decreases in expression levels of 136 elevated RAGs. B) and C) Module enrichment scores representing the significances of overlaps of the genes decreased by anti-TNF therapy (B) or the genes whose expression levels are elevated by IL1B and TNF treatments (C) with the genes belonging to the network modules. AP = Antigen processing & presentation; TC = T-cell activation; BC = B-cell activation; IG = Immunoglobulins; CA = Complement activation; NK = Natural killer cell mediated cytotoxicity; IC = Inflammatory cytokines; CK = Chemokines; CMH = Cell migration & adhesion; TLR = Toll-like receptor signaling; AF = Angiogenic factors; JS = JAK-STAT signaling; CC = Cell cycle & DNA repair; CDS = Cell death & survival; ECM = ECM organization; MR = Matrix remodeling.
Figure 4
Figure 4. Gene regulatory networks activated in RA.
A) Target enrichment scores representing the significances of overlaps between the targets of each TF and the RAGs belonging to the network modules. B–D) Gene regulatory networks describing the TF-target relationships for the three processes: T-cell activation including RUNX1 and FOXP3 (B), Matrix remodeling including AP-1 (JUN and FOS) and NFKB1 (C), and Cell proliferation and survival including NFAT5, E2F3, and TP53 (D).

References

    1. Gravallese EM, Manning C, Tsay A, Naito A, Pan C, et al. (2000) Synovial tissue in rheumatoid arthritis is a source of osteoclast differentiation factor. Arthritis Rheum 43: 250–258. - PubMed
    1. Firestein GS (2003) Evolving concepts of rheumatoid arthritis. Nature 423: 356–361. - PubMed
    1. McInnes IB, Liew FY (2005) Cytokine networks–towards new therapies for rheumatoid arthritis. Nat Clin Pract Rheumatol 1: 31–39. - PubMed
    1. Huber R, Hummert C, Gausmann U, Pohlers D, Koczan D, et al. (2008) Identification of intra-group, inter-individual, and gene-specific variances in mRNA expression profiles in the rheumatoid arthritis synovial membrane. Arthritis Res Ther 10: R98. - PMC - PubMed
    1. Kraan TCTMV, van Gaalen FA, Kasperkovitz PV, Verbeet NL, Smeets TJM, et al. (2003) Rheumatoid arthritis is a heterogeneous disease - Evidence for differences in the activation of the STAT-1 pathway between rheumatoid tissues. Arthritis Rheum 48: 2132–2145. - PubMed

Publication types

MeSH terms

Substances