. 2012;7(12):e51939.
doi: 10.1371/journal.pone.0051939. Epub 2012 Dec 11.

Quantification of the host response proteome after mammalian reovirus T1L infection

Affiliations

Quantification of the host response proteome after mammalian reovirus T1L infection

Alicia R Berard et al. PLoS One. 2012.

Abstract

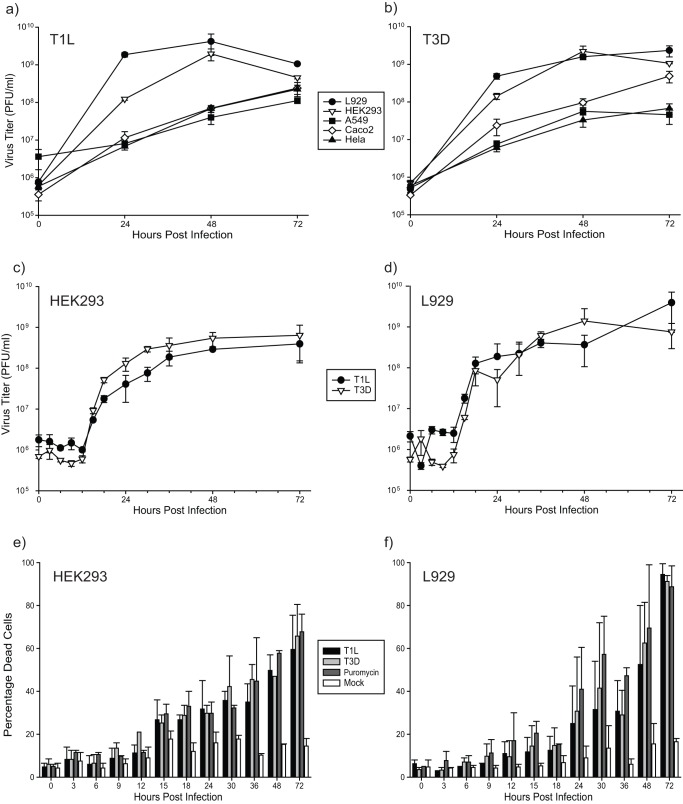
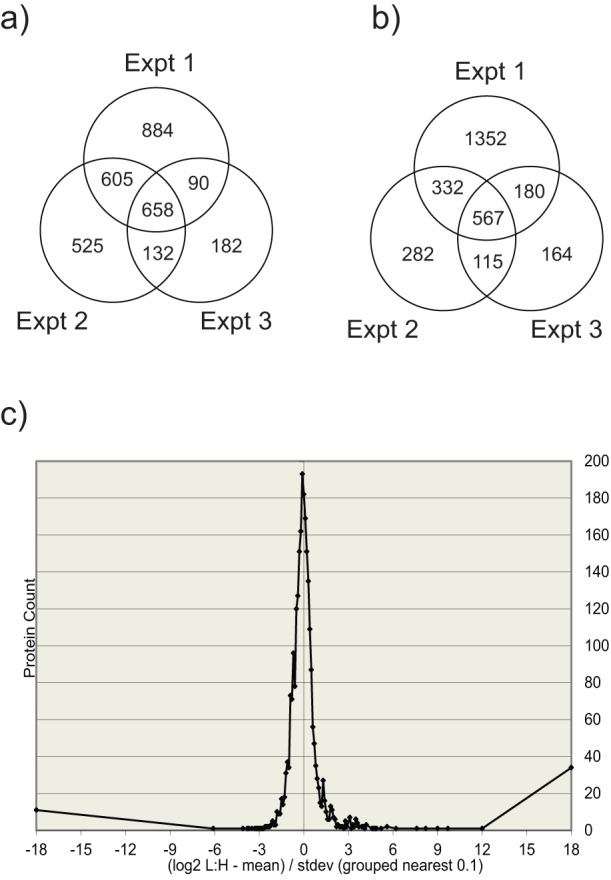
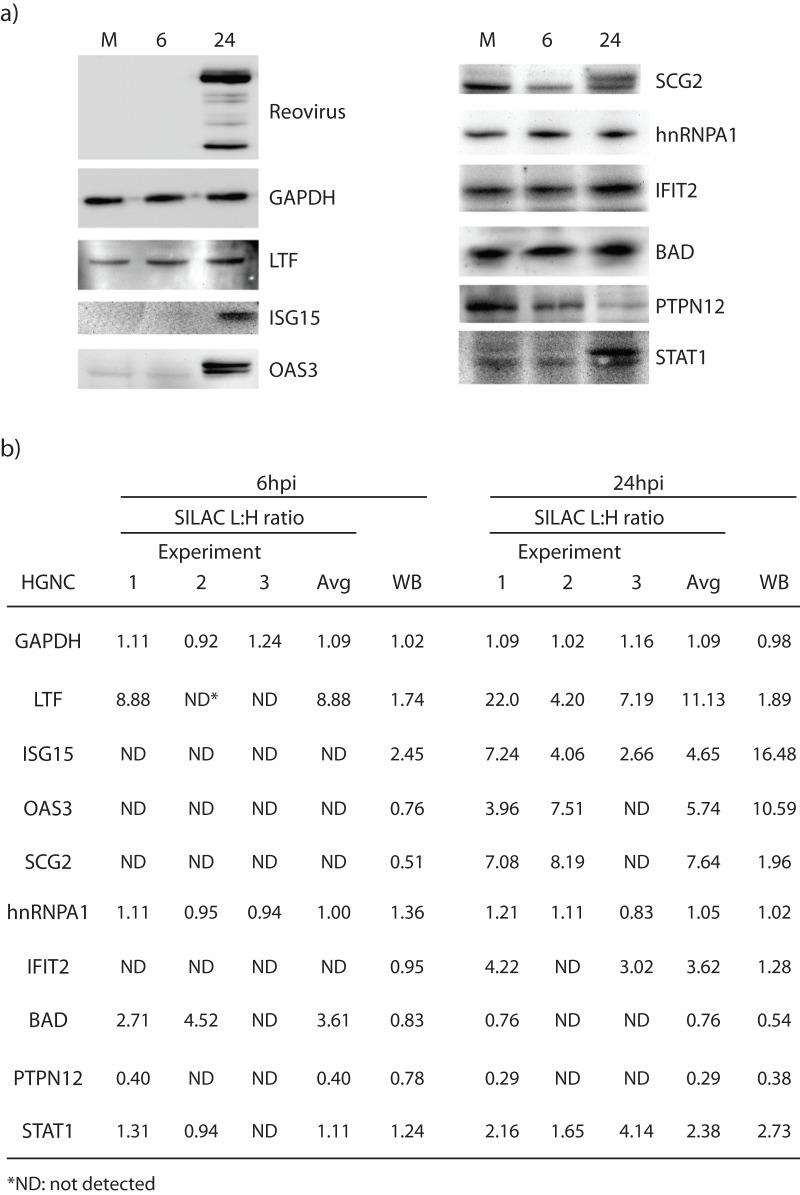
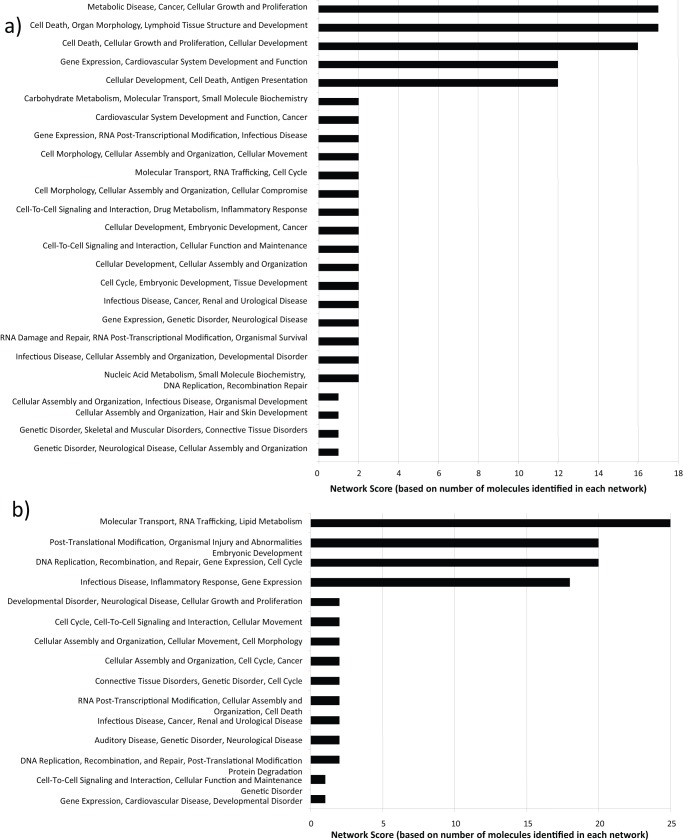
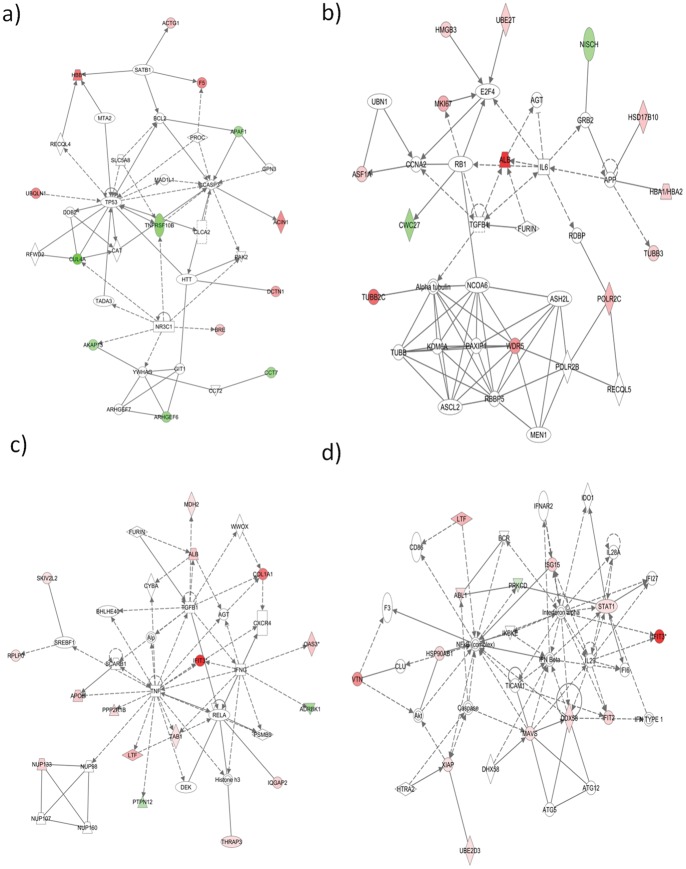
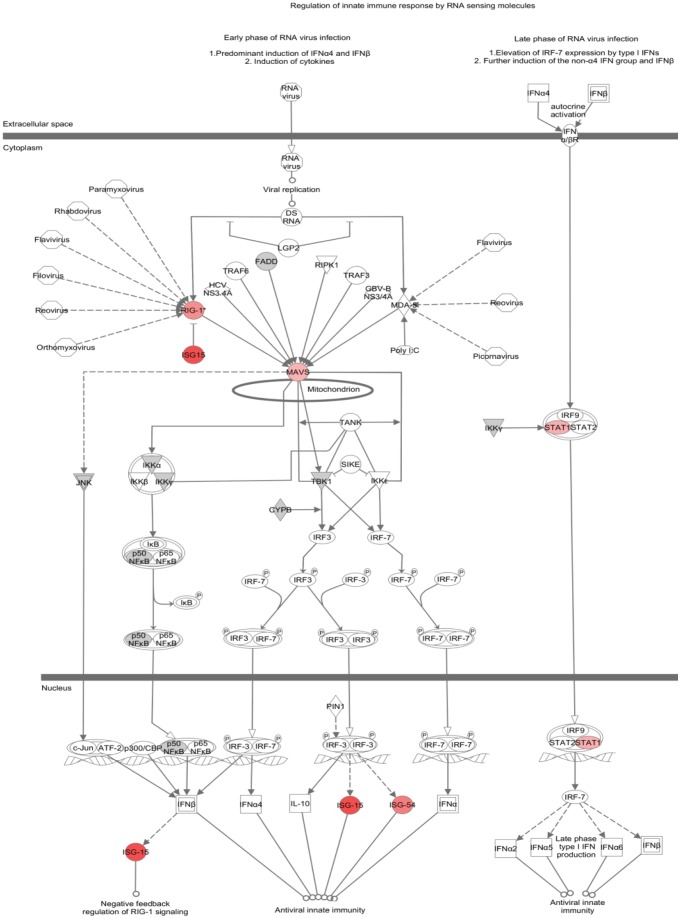
All viruses are dependent upon host cells for replication. Infection can induce profound changes within cells, including apoptosis, morphological changes, and activation of signaling pathways. Many of these alterations have been analyzed by gene arrays to measure the cellular "transcriptome." We used SILAC (stable isotope labeling by amino acids in cell culture), combined with high-throughput 2-D HPLC/mass spectrometry, to determine relative quantitative differences in host proteins at 6 and 24 hours after infecting HEK293 cells with reovirus serotype 1 Lang (T1L). 3,076 host proteins were detected at 6 hpi, of which 132 and 68 proteins were significantly up or down regulated, respectively. 2,992 cellular proteins, of which 104 and 49 were up or down regulated, respectively, were identified at 24 hpi. IPA and DAVID analyses indicated proteins involved in cell death, cell growth factors, oxygen transport, cell structure organization and inflammatory defense response to virus were up-regulated, whereas proteins involved in apoptosis, isomerase activity, and metabolism were down-regulated. These proteins and pathways may be suitable targets for intervention to either attenuate virus infection or enhance oncolytic potential.


Conflict of interest statement

Competing Interests: The authors have declared that no competing interests exist.

Figures

Figure 1
Figure 1. Kinetics of reovirus growth and viral-induced cytopathology.
Each of five different cell lines (L929, A549, HEK293, CaCo2 and Hela) were infected at MOI  = 1 PFU/cell with T1L (a) or T3D (b). Cell lysates were harvested at 0, 24, 48 and 72hpi and titrated. Experiments were performed in triplicate; error bars represent standard error. Virus titers were greatest in the L929 and HEK293 cells for both virus strains. HEK293 (c) and L929 (d) cells were then re-analyzed as in (a) and (b) after infection at MOI  = 5 and at additional time points. Aliquots of the infections in (c) and (d) were also assessed for cell viability by trypan blue exclusion (e and f, respectively), with 100 μg/ml puromycin used as a positive cell killing control. Experiments were performed in duplicate; error bars represent standard error.
Figure 2
Figure 2. Microscopic evaluation of HEK293 cells infected with reovirus at MOI 5.
(a) photomicrographs of 293 cells mock-infected (top row), or infected with T1L (middle row) or T3D (bottom row) for various times (indicated at top). Scale bar  = 40 μm. (b) HEK293 cells were infected with MRV strain T1L at MOI 5. Cells were stained for f-actin (red), reovirus (green), and DAPI (blue). At 8, 12, 18 and 24 hpi, 5.31%, 64.0%, 83.2% and 100% of cells were infected, respectively (indicated in upper rightmost corner of each image). Scale bar  = 40 μm.
Figure 3
Figure 3. Identified protein analysis.
Venn diagram summaries of the three separate T1L reovirus SILAC experiments at (a) 6hpi, when a total of 3076 unique proteins were identified and at (b) 24hpi where a total of 2992 unique proteins were identified. Overlapping numbers represent those proteins identified in more than one biological replicate (c) Population distribution represented by the log2 of L:H ratios of identified proteins plotted against the protein counts. This population distribution is used to determine the z-scores indicating those proteins considered significantly up or down regulated. Most proteins are seen at a 1∶1 ratio after infection, indicated by the peak of the population distribution indicated at 0. For clarity, only experiment 1 at 24hpi is shown, however population distributions were generated at both time points, for all biological replicates.
Figure 4
Figure 4. Validation of SILAC-determined protein abundances.
(a) Western blot analyses of selected proteins. Mock-infected and T1L-infected cells were harvested at 24hpi, lysed with 0.5% NP-40, and 20–80 μg of each cytosolic fraction resolved in each lane of 10×6.5×0.1 cm 10% SDS-mini-PAGE. Proteins were transferred to PVDF membranes, blocked, probed with various indicated primary antibodies, developed with appropriate secondary antibodies, and visualized with an Alpha Innotech FluorChemQ MultiImage III instrument. (b) Densitometry analysis comparison to SILAC L:H average ratios for the ten different host proteins in (a). Most of the Western blot results correlated to the regulation of the proteins observed in SILAC (whether or not they are up or down regulated). All of the proteins tested by Western blot were also identified at 24hpi in SILAC and were therefore used for confirmation. Some of these proteins were also identified at 6hpi in SILAC and these were used for WB comparison. (GAPDH – glyceraldehyde-3-phosphate dehydrogenase, LTF – lactotransferrin, ISG15 – interferon-stimulated protein 15kDa, OAS3 – 2′–5′oligoadenylate synthetase 3, SCG2 – secretogranin II, hnRNPA1 – heterogeneous nuclear ribonucleoprotein A1, IFIT2 – Interferon-induced protein with tetratricopeptide repeats 2, BAD – Bcl-2 binding component 6, PTPN12 – protein tyrosine phosphatase, non-receptor type 12, STAT1 – signal transducer and activator of transcription 1).
Figure 5
Figure 5. Top network functions generated using Ingenuity protein analysis for HEK293 cells infected with T1L reovirus at (a) 6hpi and (b) 24hpi.
Graphs represent host cell functions with highest score (x-axis) based on the number of differentially regulated proteins observed in that network. The higher the score, the greater the number of proteins differentially regulated in that particular function network.
Figure 6
Figure 6. Functional network analysis of differentially regulated proteins observed in T1L infected HEK293 cells at 6hpi (a, b) and 24hpi (c, d).
The top network functions identified in the previous figure are shown in more detail with interconnecting protein relationships indicated by solid (direct interaction) or dashed (indirect interaction) lines. Red/pink molecules represent proteins up-regulated; green molecules represent down-regulation. (a) Network 1, 6hpi; top functions include cell death (b) Network 2, 6hpi; top functions include cellular growth and proliferation. (c) Network 1, 24hpi; top functions include molecular transport. (d) Network 4, 24hpi; top functions include infectious disease and inflammatory response.
Figure 7
Figure 7. Canonical pathway “Activation of IRF by cytosolic pattern recognition receptors” that was identified as significantly (p-value of 3.7×10⁻⁵) altered after 24 h of T1L reovirus infection in HEK293 cells.
Protein regulation expression patterns overlaid from first biological replicate. Red indicates up-regulation, grey represents proteins not changed in abundance after infection and white represents molecules not identified in SILAC experiment but are part of the known canonical pathway.

Similar articles

Cited by

References

    1. Clarke P, Tyler KL (2003) Reovirus-induced apoptosis: A minireview. Apoptosis 8: 141–150. - PubMed
    1. Tan SL, Ganji G, Paeper B, Proll S, Katze MG (2007) Systems biology and the host response to viral infection. Nat Biotechnol 25: 1383–1389. - PMC - PubMed
    1. Lang QL, Zhou XC, Zhang XL, Drabek R, Zuo ZX, et al. (2011) Microarray-based identification of tomato microRNAs and time course analysis of their response to Cucumber mosaic virus infection. J Zhejiang Univ Sci B 12: 116–125. - PMC - PubMed
    1. Salgado M, Lopez-Romero P, Callejas S, Lopez M, Labarga P, et al. (2011) Characterization of host genetic expression patterns in HIV-infected individuals with divergent disease progression. Virology 411: 103–112. - PubMed
    1. Nesvizhskii AI, Aebersold R (2005) Interpretation of shotgun proteomic data: the protein inference problem. Mol Cell Proteomics 4: 1419–1440. - PubMed

Publication types