

Frequency of patient contact with health care personnel and visitors: implications for infection prevention
- PMID: 23240264
- PMCID: PMC3531228
- DOI: 10.1016/s1553-7250(12)38073-2
Frequency of patient contact with health care personnel and visitors: implications for infection prevention
Abstract
Background: Contact with health care workers may be an important means of infection transmission between patients, yet little is known about patterns of patient contact with staff and visitors in hospitals. In a cross-sectional study, the frequency, type, and duration of contacts made by health care workers, other hospital staff, and visitors to patients in acute care settings were documented.
Methods: Patients were observed in seven units of three academic hospitals, with recording of each occurrence of someone's entry into the patient's room. The health care worker's role, the duration of the visit, and the highest level of patient contact made were noted. Staff were also surveyed to determine their perception of how many patients per hour they come into contact with, how long they spend with patients, and the level of patient contact that occurs.
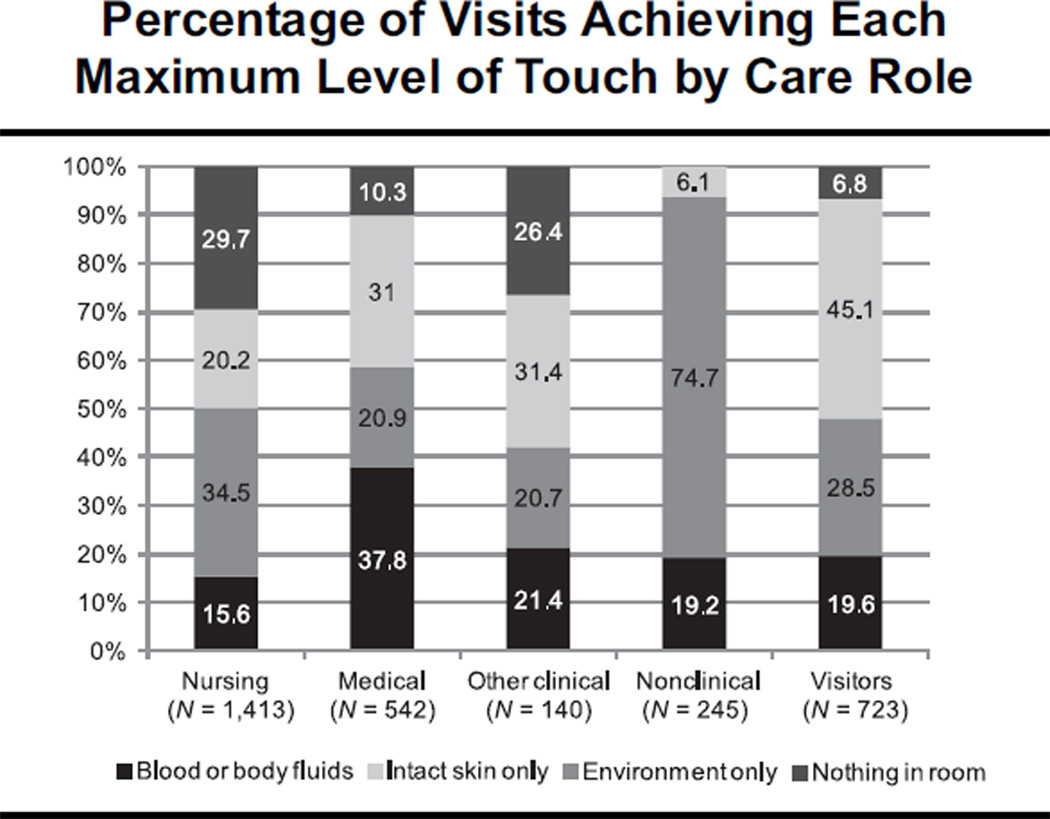
Findings: Hourly room entries ranged from 0 to 28 per patient (median, 5.5), and patients received visits from 0 to 18 different persons per hour (median, 3.5). Nurses made the most visits (45%), followed by personal visitors (23%), medical staff (17%), nonclinical staff (7%), and other clinical staff (4%). Visits lasted 1 to 124 minutes (median, 3 minutes for all groups). Persons entering patients' rooms touched nothing inside the room, only the environment, the patient's intact skin, or the patient's blood/body fluids 22%, 33%, 27%, and 18% of the time, respectively. Medical staff estimated visiting an average of 2.8 different patients per hour (range, 0.5-7.0), and nursing staff estimated visiting an average of 4.5 different patients per hour (range, 0.5-18.0).
Conclusions: Examining patterns of patient contact may improve understanding of transmission dynamics in hospitals. New transmission models should consider the roles of health care workers beyond patients' assigned nurses and physicians.
Figures
References
-
- US Centers for Disease Control and Prevention. [Accessed Oct. 22, 2012];The Direct Medical Costs of Healthcare-Associated Infections in U.S. Hospitals and the Benefits of Prevention. 2009 Mar; http://www.cdc.gov/HAI/pdfs/hai/Scott_CostPaper.pdf.
-
- The Joint Commission. 2013 Comprehensive Accreditation Manual for Hospitals: The Official Handbook. Oak Brook, IL: Joint Commission Resources; 2012.
-
- Weinstein RA. Epidemiology and control of nosocomial infections in adult intensive care units. Am J Med. 1991 Sep 16;91(3B):179S–184S. - PubMed
Publication types
MeSH terms
Grants and funding
LinkOut - more resources
Full Text Sources
Other Literature Sources
