. 2013 Feb 1;12(2):679-91.
doi: 10.1021/pr3007705. Epub 2013 Jan 14.

Feasibility of identifying the tobacco-related global metabolome in blood by UPLC-QTOF-MS

Affiliations
Free PMC article

Feasibility of identifying the tobacco-related global metabolome in blood by UPLC-QTOF-MS

Ping-Ching Hsu et al. J Proteome Res. .
Free PMC article

Abstract

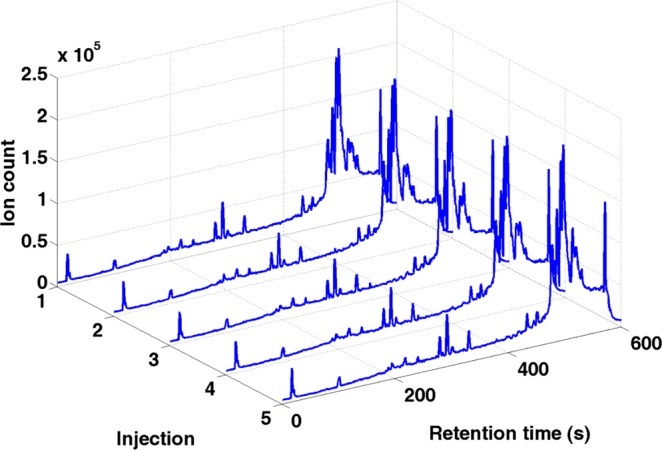
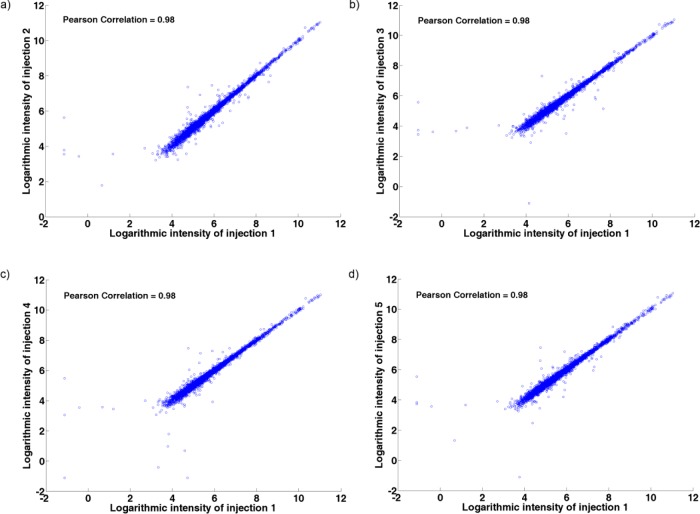
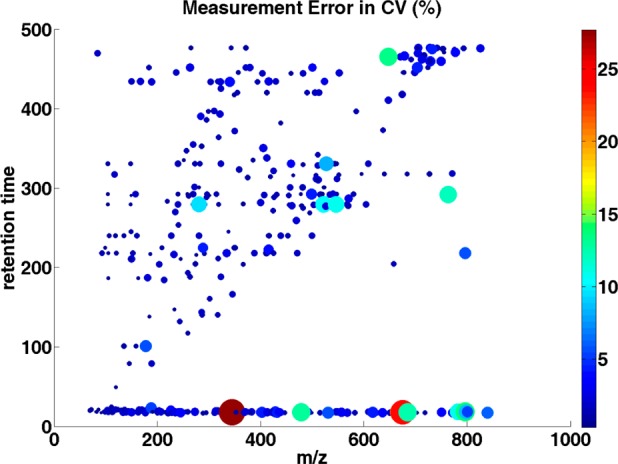
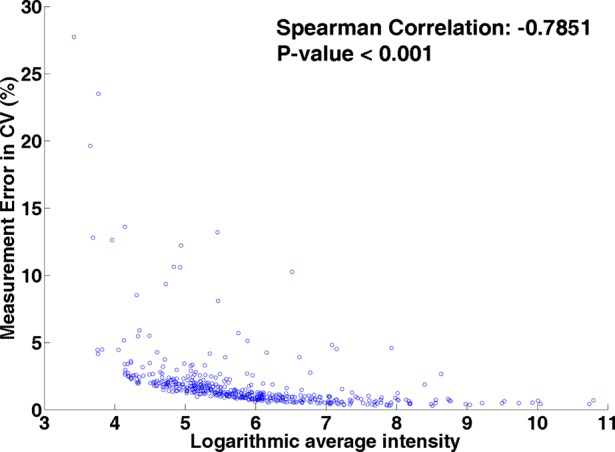
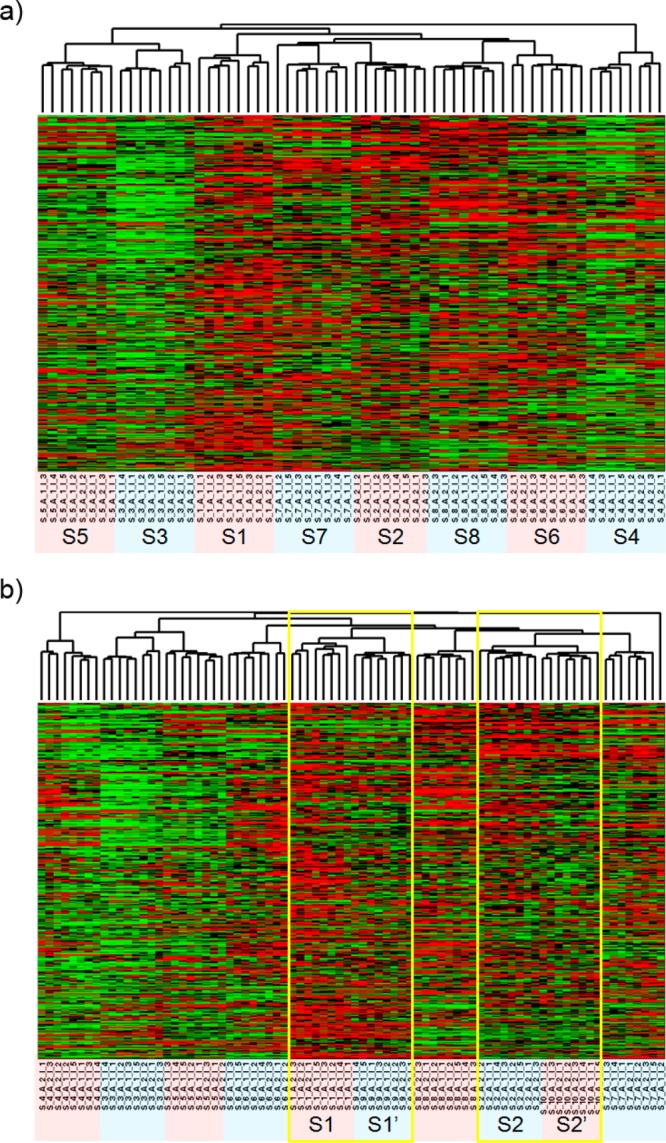
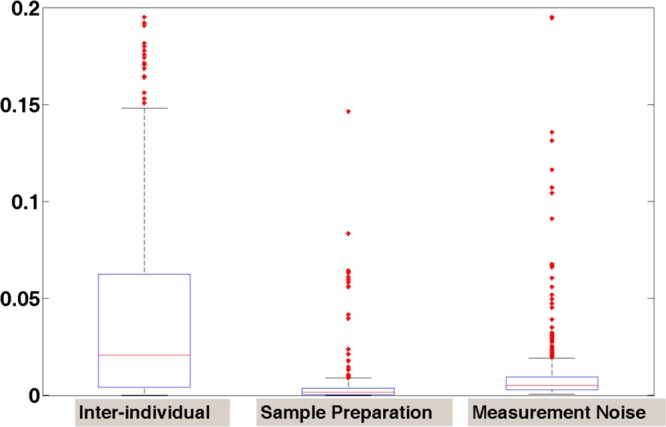
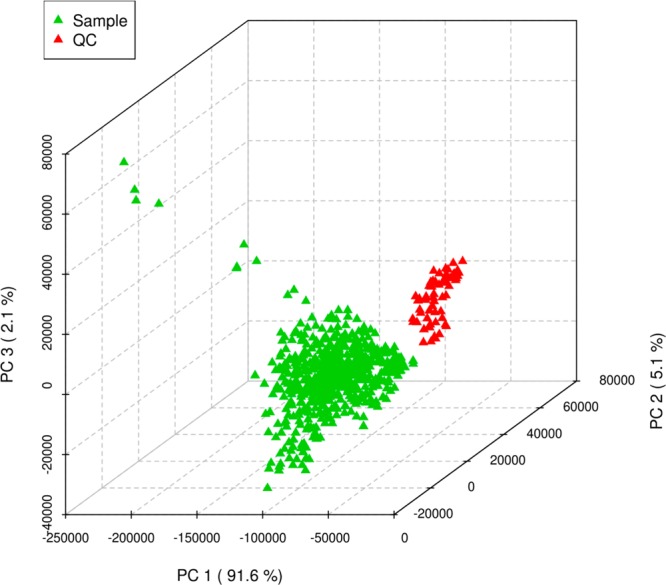
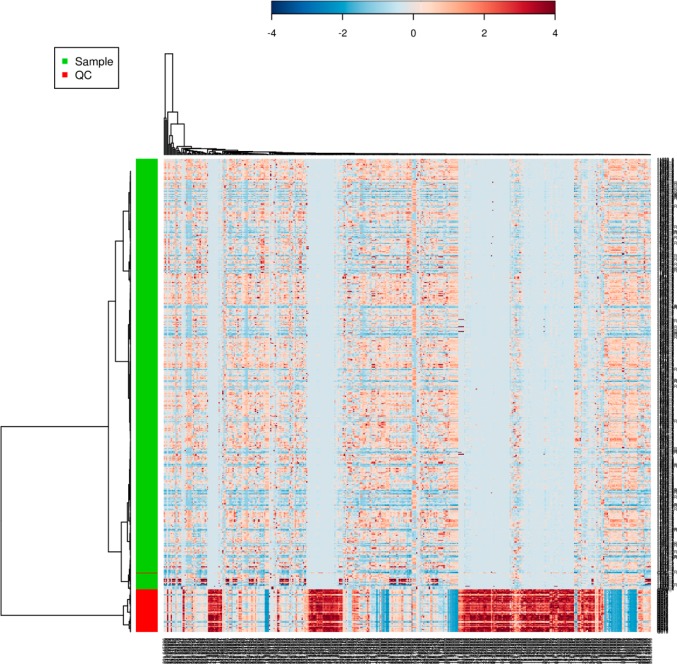
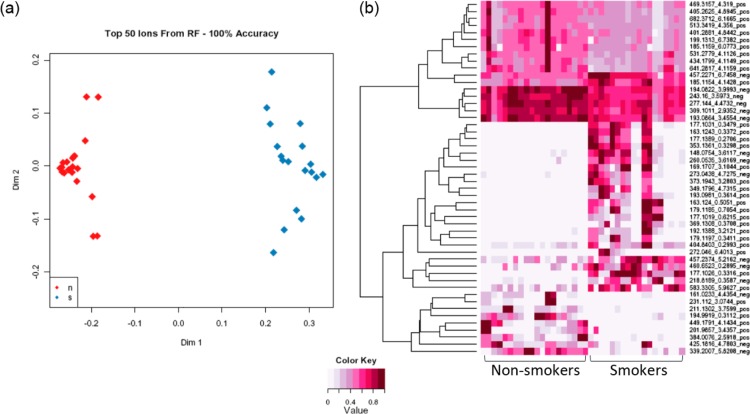
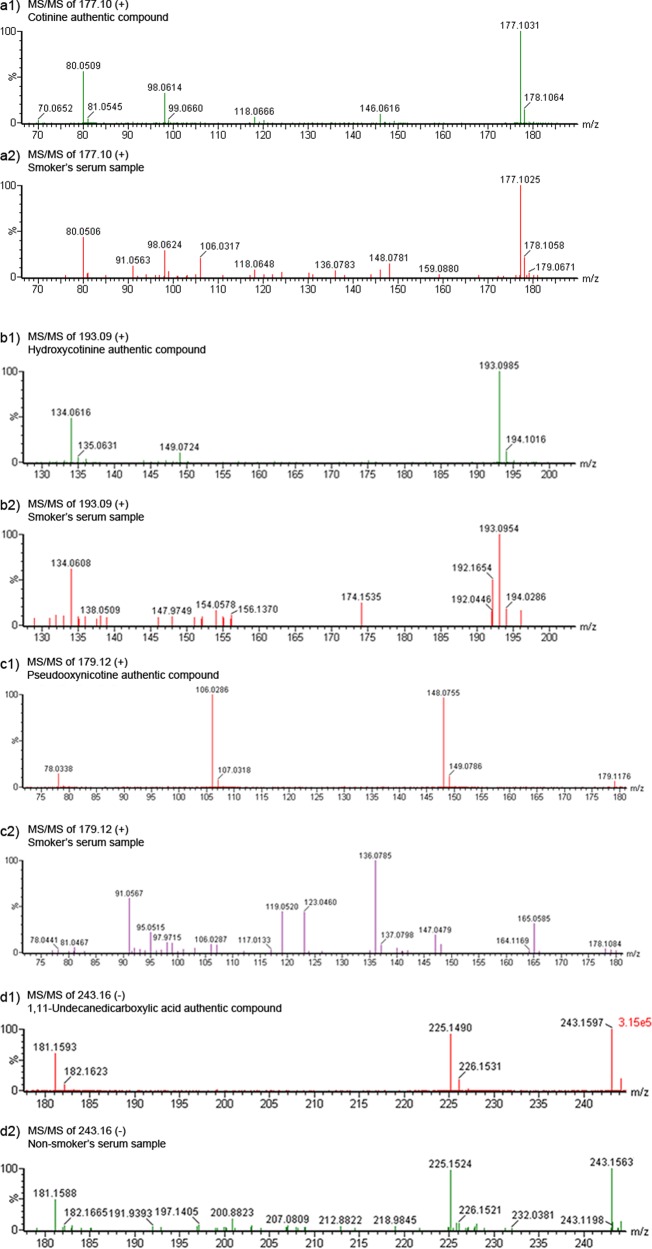
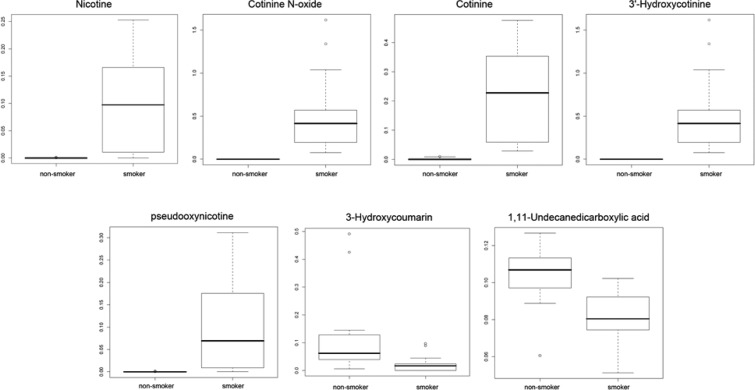
Metabolomics is likely an ideal tool to assess tobacco smoke exposure and the impact of cigarette smoke on human exposure and health. To assess reproducibility and feasibility of this by UPLC-QTOF-MS, three experiments were designed for the assessment of smokers' blood. Experiment I was an analysis of 8 smokers with 8 replicates. Experiment II was an analysis of 62 pooled quality control (QC) samples from 7 nonsmokers' plasma placed as every tenth sample among a study of 613 samples from 160 smokers. Finally, to examine the feasibility of metabolomic study in assessing smoke exposure, Experiment III consisted of 9 smokers and 10 nonsmokers' serum to evaluate differences in their global metabolome. There was minimal measurement and sample preparation variation in all experiments, although some caution is needed when analyzing specific parts of the chromatogram. When assessing QC samples in the large scale study, QC clustering indicated high stability, reproducibility, and consistency. Finally, in addition to the identification of nicotine metabolites as expected, there was a characteristic profile distinguishing smokers from nonsmokers. Metabolites selected from putative identifications were verified by MS/MS, showing the potential to identify metabolic phenotypes and new metabolites relating to cigarette smoke exposure and toxicity.


Figures

Figure 1
Figure 1
Total ion chromatogram of the five injections of the first aliquot of S1.
Figure 2
Figure 2
Evaluation of the variation due to the measurement noise. Scatter plots of logarithmic intensities of the five injections of the first aliquot of S1 to S8 represents (a) first injections vs second injections, (b) first injections vs third injections, (c) first injections vs fourth injections, and (d) first injections vs fifth injections.
Figure 3
Figure 3
Distribution of the estimated measurement error in CV (%) over m/z values and retention times. Each dot represents a single peak. The dot size and color corresponds to the CV value: the larger the dot, and the brighter the color of the dot, the larger the CV value of the individual peak.
Figure 4
Figure 4
Scatter plot of the estimated measurement noise in coefficient of variation (%) versus the mean intensities of peaks over S1 to S8.
Figure 5
Figure 5
Hierarchical clustering of all metabolites (a) from subject 1 (S1) to subject 8 (S8) and (b) from S1 to S8 plus the analytical replicates S1′ and S2′. Heat map colors represent relative values, in which red represents values above the mean, black represents the mean, and green represents values below the mean of a row (metabolite) across all columns (samples).
Figure 6
Figure 6
Box-plot of the estimated variances due to interindividual variation, sample preparation and measurement noise.
Figure 7
Figure 7
Scores plot between the selected principle components (PCs) showed difference between samples and QCs in their metabolomic profiles. The explained variances captured by each PC were shown in brackets.
Figure 8
Figure 8
Clustering result shown as heatmap (distance measure using pearson, and clustering algorithm using ward) of the pooled QC samples and experimental samples.
Figure 9
Figure 9
Top 50 metabolites selected from Random Forests. (a) Forest accuracies were calculated and the sample classifications were presented by Multidimensional scaling (MDS) plot. In this plot, nonsmokers (red) and smokers (blue) were well separated in serum samples. (b) Visualization of the top metabolites across all samples identifies the rank importance of the ions.
Figure 10
Figure 10
MS/MS spectrum from authentic compounds of cotinine (a1), hydroxycotinine (b1), pseudooxynicotine (c1), and 1,11-undecanedicarboxylic acid (d1). MS/MS spectrum obtained from serum samples of smoker (a2, b2, c2) or nonsmoker (d2) were also presented for comparison.
Figure 11
Figure 11
Box plots of peak areas for seven candidate metabolites among smokers and nonsmokers. The points outside the quartiles are outliers.

References

    1. Department of Health U. S. Smoking and health. In The Surgeon General’s Report on Nutrition and Health; United States. Public Health Service. Office of the Surgeon General: Washington, D.C., 1988; pp 5–11.
    1. International Agency for Research on Cancer IARC Monographs on the Evaluation of Carcinogenic Risks to Humans; IARC: Lyon, France, 2004; pp 53–119. - PMC - PubMed
    1. International Agency for Research on Cancer. IARC Monographs on the Evaluation of the Carcinogenic Risk of Chemicals to Humans: Tobacco Smoking, Vol. 38; IARC: Lyon, 1986.
    1. Institute of Medicine; Committee to Assess the Science Base for Tobacco Harm Reduction; Board on Health Promotion and Disease Prevention Clearing the Smoke: Assessing the Science Base for Tobacco Harm Reduction; National Acadamy Press: Washington, D.C., 2001.
    1. Institute of Medicine; Committee to Assess the Science Base for Tobacco Harm Reduction; Board on Population Health and Public Health Practice. Scientific Standards for Studies on Modified Risk Tobacco Products. 2011. Ref Type: Report

Publication types