. 2013 Feb;33(2):224-31.
doi: 10.1161/ATVBAHA.112.300445. Epub 2012 Dec 13.

Human apolipoprotein A-II protects against diet-induced atherosclerosis in transgenic rabbits

Affiliations

Human apolipoprotein A-II protects against diet-induced atherosclerosis in transgenic rabbits

Yao Wang et al. Arterioscler Thromb Vasc Biol. 2013 Feb.

Abstract

Objective: Apolipoprotein (apo) A-II is the second major apo of high-density lipoproteins, yet its pathophysiological roles in the development of atherosclerosis remain unknown. We aimed to examine whether apo A-II plays any role in atherogenesis and, if so, to elucidate the mechanism involved.

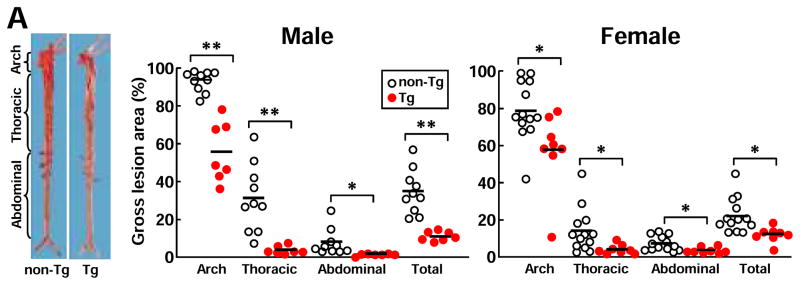
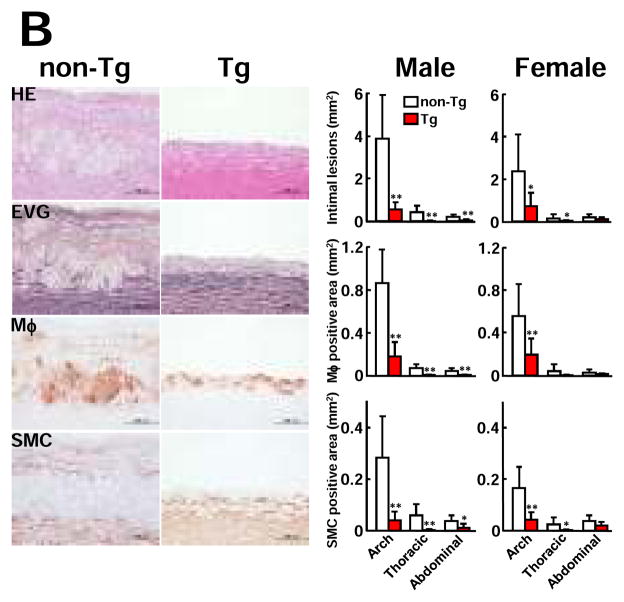
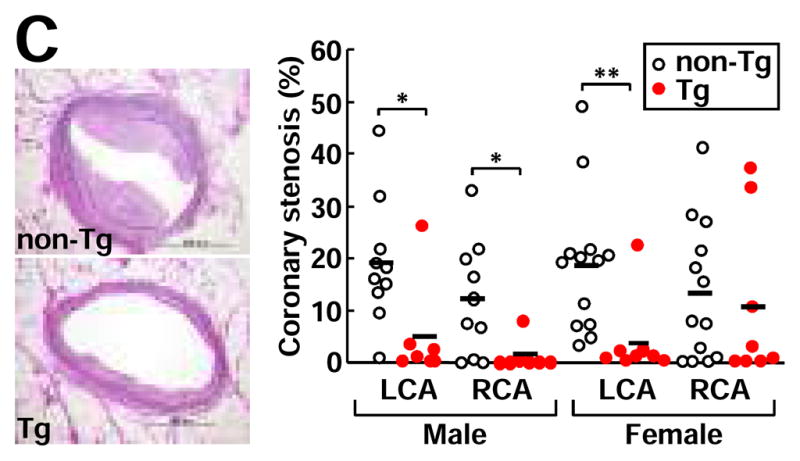
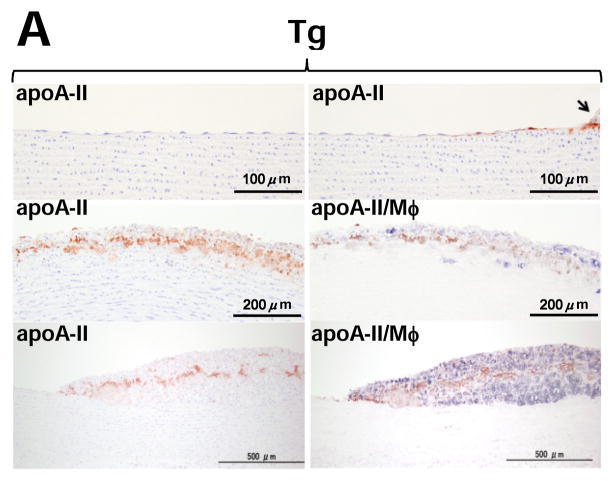
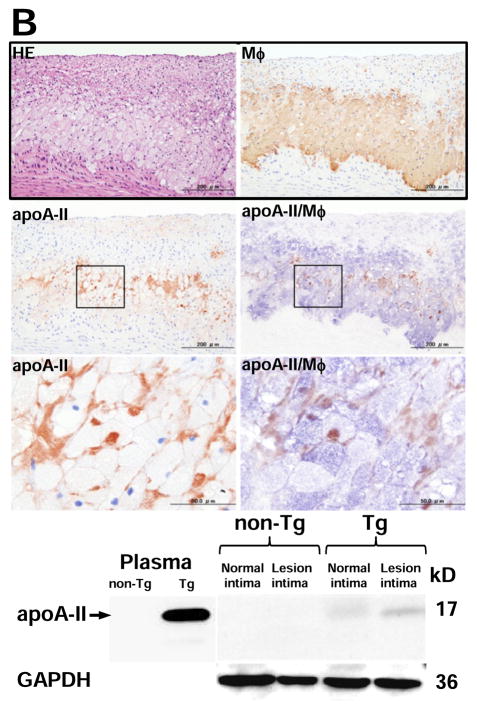
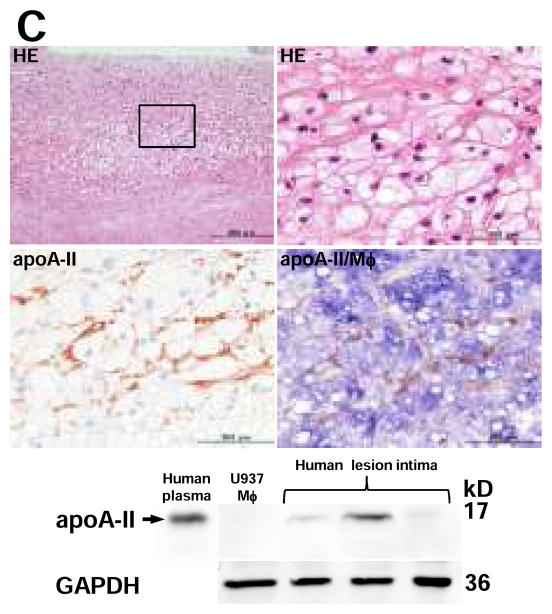
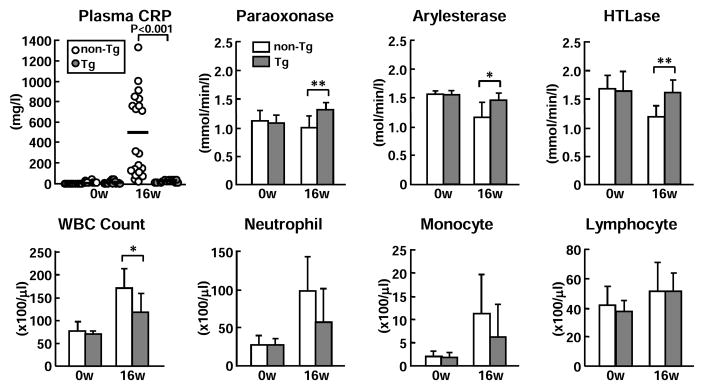
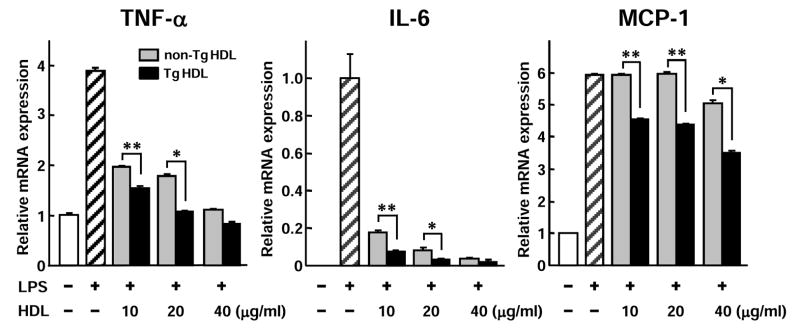
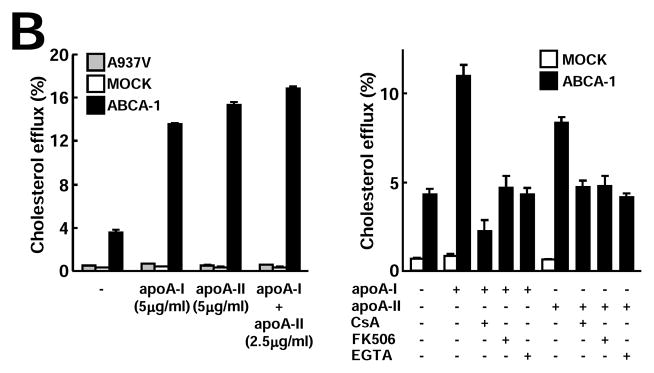
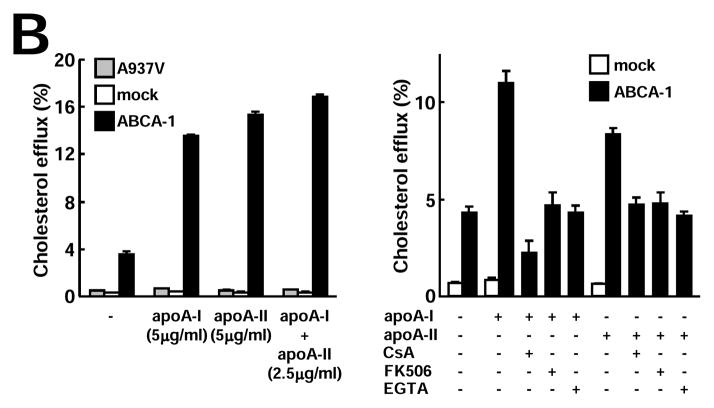
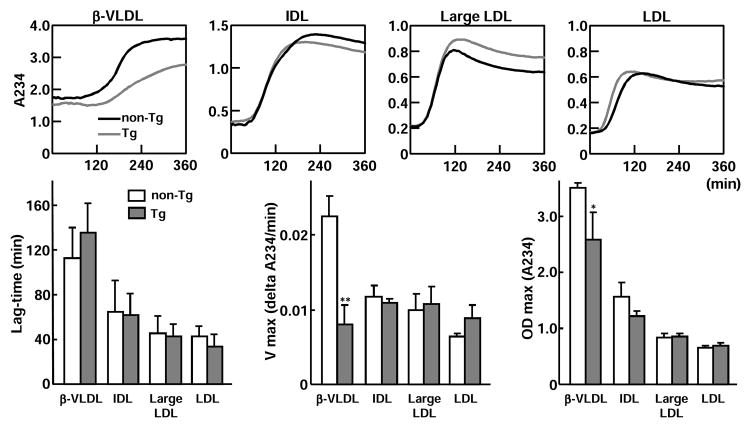
Methods and results: We compared the susceptibility of human apo A-II transgenic (Tg) rabbits to cholesterol diet-induced atherosclerosis with non-Tg littermate rabbits. Tg rabbits developed significantly less aortic and coronary atherosclerosis than their non-Tg littermates, while total plasma cholesterol levels were similar. Atherosclerotic lesions of Tg rabbits were characterized by reduced macrophages and smooth muscle cells, and apo A-II immunoreactive proteins were frequently detected in the lesions. Tg rabbits exhibited low levels of plasma C-reactive protein and blood leukocytes compared with non-Tg rabbits, and high-density lipoproteins of Tg rabbit plasma exerted stronger cholesterol efflux activity and inhibitory effects on the inflammatory cytokine expression by macrophages in vitro than high-density lipoproteins isolated from non-Tg rabbits. In addition, β-very-low-density lipoproteins of Tg rabbits were less sensitive to copper-induced oxidation than β-very-low-density lipoproteins of non-Tg rabbits.

Conclusions: These results suggest that enrichment of apo A-II in high-density lipoprotein particles has atheroprotective effects and apo A-II may become a target for the treatment of atherosclerosis.


Figures

Figure 1
Figure 1. Analysis of atherosclerotic lesions of aorta and coronary arteries
A, Representative photographs of pinned-out aortic trees stained with Sudan IV from non-Tg and Tg rabbits are shown (left), and aortic atherosclerotic lesions (defined by sudanophilic area) on the surface were quantified with an image analysis system (right). Each dot represents the lesion area of an individual animal.*P<0.05,**P<0.01 vs. non-Tg. B, Representative micrographs of the aortic lesions from male non-Tg and Tg rabbits. Serial paraffin sections were stained with hematoxylin-eosin (HE) and elastica van Gieson (EVG) or immunohistochemically stained with mAbs against either macrophages (Mφ) or α-smooth muscle actin for smooth muscle cells (SMC) (left). Intimal lesions on EVG-stained sections and positively immunostained areas of macrophages and smooth muscle cells were quantified with an image analysis system (right). N= 7 and 13 for male Tg and non-Tg and 8 and 10 for female Tg and non-Tg. *P<0.05,**P<0.01 vs. non-Tg. C, The heart was cut into 7 blocks and blocks I and II containing left and right coronary trunks were sectioned in 500 μm intervals (3 sections from each block) and stained with EVG. Representative micrographs of coronary atherosclerosis of the left main trunks stained by EVG (left). Coronary stenosis =lesion area/total lumen area x100(%) was measured and is expressed as percentage (right). LCA: left coronary artery trunks; RCA: right coronary artery trunks. *P<0.05,**P<0.01 vs. non-Tg.
Figure 2
Figure 2. Demonstration of apo A-II immunoreactive proteins in lesions of Tg rabbit and human atherosclerosis
Representative micrographs of normal intima and early-stage lesions (A), and fatty streak (foam cell-rich lesions) (B top) of Tg rabbits. Serial paraffin sections were stained with HE or Abs against human apo A-II alone or double-stained with apoA-II (stained as red) and macrophage (stained as blue) Abs (labeled as apo A-II/Mφ%. Normal intima and atherosclerotic intima (grossly) of Tg rabbits were analyzed by 4–20% SDS-PAGE under non-reducing conditions and followed by immunoblotting using human apo A-II polyclonal Ab (B bottom). C, Representative micrographs of advanced lesion from human carotid artery (top). Serial paraffin sections of the lesions were stained with HE, polyclonal Ab against human apo A-II, and double staining with Abs against apo A-II (stained as red) and human macrophage (stained as blue). Human aortic atherosclerotic intima of three autopsy cases was analyzed by 4–20% SDS-PAGE under non-reducing conditions and followed by immunoblotting using human apo A-II polyclonal Ab (bottom). Proteins isolated from U937-derived macrophages were used as the negative control and 1 μL of human plasma was used as the positive control. GAPDH proteins are shown at the bottom to indicate the relative amount of proteins loaded in each lane.
Figure 3
Figure 3. Analysis of plasma CRP, PON1 activity (top) and white blood cells (bottom)
Plasma levels of CRP of non-Tg (white dot) and Tg rabbits (gray dots) were measured by ELISA. Serum PON1 activity was measured using three different substrates. Data are expressed as mean ± SD.*P<0.05,**P<0.01 vs. non-Tg. N= 6 ~13 from each group containing both males and females.
Figure 4
Figure 4. Inhibitory effects of HDLs on cytokine expression in macrophages
U937 macrophages were treated with LPS or in the presence of HDL3 isolated from either non-Tg or Tg rabbit plasma for 24 h and mRNA expression of TNF-α, IL-6, and MCP-1 was measured by real-time RT-PCR. HDLs were fractionated by SDS-PAGE and shown in the middle insert. Representative data from three separate experiments are shown. Data are expressed as mean ± SD.*P<0.05,**P<0.01 vs. non-Tg.
Figure 5
Figure 5
Figure 5A. Analysis of cholesterol efflux capacity of HDLs Apo A-I and apo A-II contents were analyzed by SDS-PAGE and stained with Coomassie brilliant blue (top). Each lane represents one sample from one rabbit. [3H] acetylated-LDL-loaded human THP-1 macrophages were incubated with different doses of HDLs for 24 h and data are expressed as percent cholesterol effluxed (bottom). N=3 for each group. **P<0.01,***P<0.001 vs. non-Tg. Figure 5B. ABCA-1 is required for apo A-I- and apo A-II-mediated cholesterol efflux Cholesterol efflux assay was performed using BHK cells transfected with either mock or ABCA-1 vectors as described. ABCA-1 is essential for both apo A-I- and apo A-II-mediated cholesterol efflux (left). In the presence of ABCA-1 inhibitors cyclosporin A (CsA), ethylene glycol tetraacetic acid (EGTA), and tacrolimus (FK506), both apo A-I- and apo A-II-mediated cholesterol efflux activity in ABCA-1-transfected BHK cells was inhibited (right). Representative data of three independent experiments are shown.
Figure 5
Figure 5
Figure 5A. Analysis of cholesterol efflux capacity of HDLs Apo A-I and apo A-II contents were analyzed by SDS-PAGE and stained with Coomassie brilliant blue (top). Each lane represents one sample from one rabbit. [3H] acetylated-LDL-loaded human THP-1 macrophages were incubated with different doses of HDLs for 24 h and data are expressed as percent cholesterol effluxed (bottom). N=3 for each group. **P<0.01,***P<0.001 vs. non-Tg. Figure 5B. ABCA-1 is required for apo A-I- and apo A-II-mediated cholesterol efflux Cholesterol efflux assay was performed using BHK cells transfected with either mock or ABCA-1 vectors as described. ABCA-1 is essential for both apo A-I- and apo A-II-mediated cholesterol efflux (left). In the presence of ABCA-1 inhibitors cyclosporin A (CsA), ethylene glycol tetraacetic acid (EGTA), and tacrolimus (FK506), both apo A-I- and apo A-II-mediated cholesterol efflux activity in ABCA-1-transfected BHK cells was inhibited (right). Representative data of three independent experiments are shown.
Figure 6
Figure 6. Analysis of apoB-containing lipoprotein oxidizability
Four apoB-containing lipoprotein fractions (β-VLDL, IDL, large LDL, and LDL) isolated from cholesterol-fed non-Tg and Tg rabbits were used for evaluation of copper-induced lipoprotein oxidation by monitoring the change of the conjugate-diene absorbance at 234 nm. Representative dynamic changes are shown on the top and absorbance of lag-time, maximal oxidation speed (V max), and maximal diene concentrations are shown at the bottom. N=3 for each group and data are expressed as mean ± SD. *P<0.05,**P<0.01 vs. non-Tg.

Comment in

Similar articles

Cited by

References

    1. Gordon T, Castelli WP, Hjortland MC, Kannel WB, Dawber TR. High density lipoprotein as a protective factor against coronary heart disease. The Framingham Study. Am J Med. 1977;62:707–714. - PubMed
    1. Rader DJ. Molecular regulation of HDL metabolism and function: implications for novel therapies. J Clin Invest. 2006;116:3090–3100. - PMC - PubMed
    1. Linsel-Nitschke P, Tall AR. HDL as a target in the treatment of atherosclerotic cardiovascular disease. Nat Rev Drug Discov. 2005;4:193–205. - PubMed
    1. Degoma EM, Rader DJ. Novel HDL-directed pharmacotherapeutic strategies. Nat Rev Cardiol. 2011;8:266–277. - PMC - PubMed
    1. Chan DC, Ng TW, Watts GF. Apolipoprotein A-II: evaluating its significance in dyslipidaemia, insulin resistance, and atherosclerosis. Ann Med. 2012;44:313–324. - PubMed

Publication types

MeSH terms