. 2012 Dec 15:13:36.
doi: 10.1186/1471-2121-13-36.

Association of telomere instability with senescence of porcine cells

Affiliations

Association of telomere instability with senescence of porcine cells

Guangzhen Ji et al. BMC Cell Biol. .

Abstract

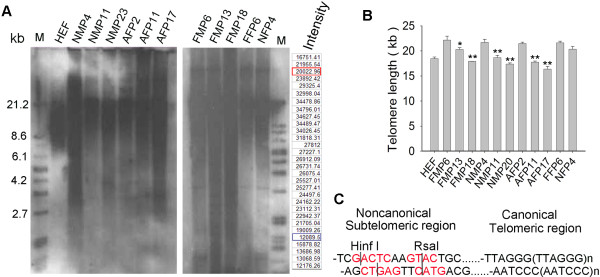
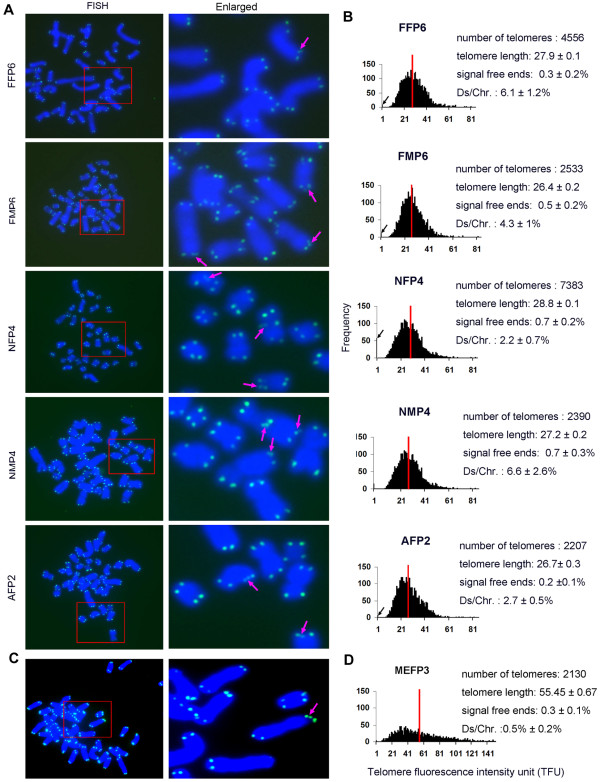
Background: Telomeres are essential for the maintenance of genomic stability, and telomere dysfunction leads to cellular senescence, carcinogenesis, aging, and age-related diseases in humans. Pigs have become increasingly important large animal models for preclinical tests and study of human diseases, and also may provide xeno-transplantation sources. Thus far, Southern blot analysis has been used to estimate average telomere lengths in pigs. Telomere quantitative fluorescence in situ hybridization (Q-FISH), however, can reveal status of individual telomeres in fewer cells, in addition to quantifying relative telomere lengths, and has been commonly used for study of telomere function of mouse and human cells. We attempted to investigate telomere characteristics of porcine cells using telomere Q-FISH method.

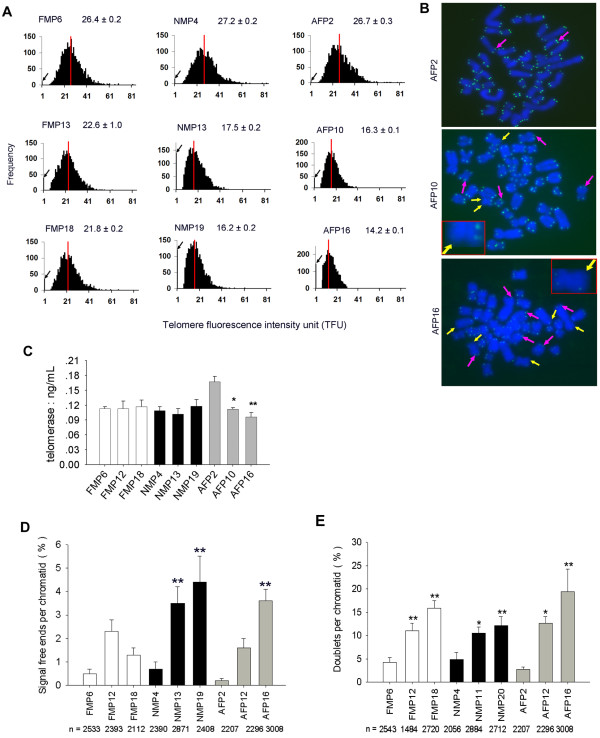
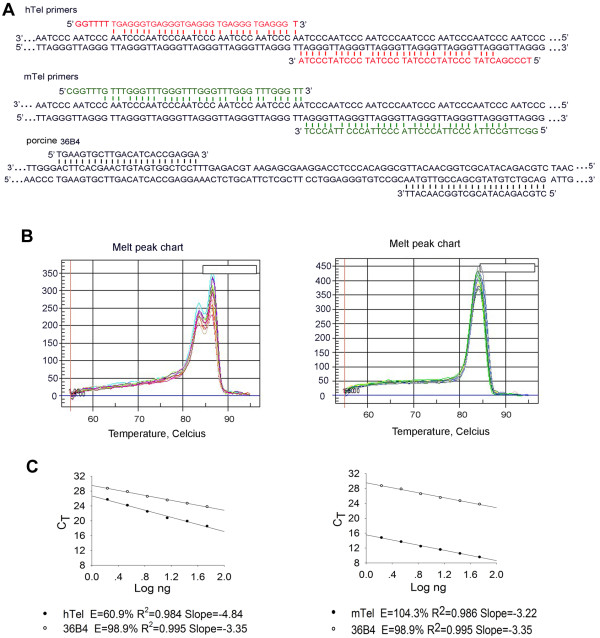
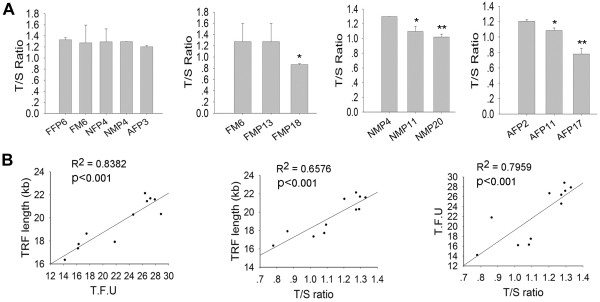
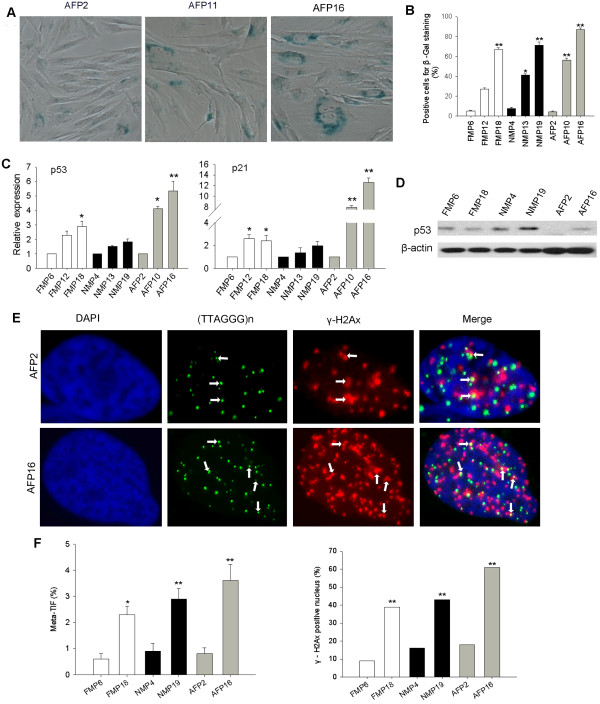
Results: The average telomere lengths in porcine cells measured by Q-FISH correlated with those of quantitative real-time PCR method (qPCR) or telomere restriction fragments (TRFs) by Southern blot analysis. Unexpectedly, we found that porcine cells exhibited high incidence of telomere doublets revealed by Q-FISH method, coincided with increased frequency of cellular senescence. Also, telomeres shortened during subculture of various porcine primary cell types. Interestingly, the high frequency of porcine telomere doublets and telomere loss was associated with telomere dysfunction-induced foci (TIFs). The incidence of TIFs, telomere doublets and telomere loss increased with telomere shortening and cellular senescence during subculture.

Conclusion: Q-FISH method using telomere PNA probe is particularly useful for characterization of porcine telomeres. Porcine cells exhibit high frequency of telomere instability and are susceptible to telomere damage and replicative senescence.


Figures

Figure 1
Figure 1
Telomere length indicated as terminal restriction fragments (TRFs) by Southern blot analysis. (A) Distribution of telomere length as TRFs of various pig cell types. Each lane shows the intensity of TRF from different samples. At last 30 grids were scanned for each sample. Take HEF for example, “Intensity” indicates the scanned intensity of each grid. The Intensity in red and blue rectangle was used as threshold of the upper and lower background, and values above them for calculation of telomere length as detailed in Methods. FF and FM, fetal fibroblast and mesenchymal cells derived from embryonic day 50, respectively; NF and NM, newborn (7 or 8 days after birth) fibroblast and mesenchymal cells, respectively; AF, adult fibroblast from the ear skin of an adult pig, 3–4 months after birth; P, passage. (B) Average telomere lengths shown as TRFs in kilobase (kb) pairs of different cell types and changes in telomere lengths during passages. HEF, human embryonic fibroblasts. The data (mean±S.E.) was averaged from three independent experiments. *, p < 0.05; **, p < 0.01, compared to the earliest passage of the same cell types, by ANOVA analysis using Statview software. (C) Schematic representation of terminal restriction sites for digestion by enzyme combinations HinfI and RsaI.
Figure 2
Figure 2
Telomere length and structure analysis by telomere quantitative fluorescence in situ hybridization (Q-FISH). (A) Representative images of telomere Q-FISH in pig cells. Red rectangle, enlarged region shown in the right column. FF and FM, fetal fibroblast and mesenchymal cells derived from fetus at embryonic day 50, respectively; NF and NM, newborn (7 or 8 days after birth) fibroblast and mesenchymal cells, respectively; AF, adult fibroblasts from the ear skin of an adult pig, 3–4 months after birth. P, passages. Enlarged views: Blue, DAPI-stained chromosomes. Green dots, telomeres; Purple arrows, telomere doublets; P, passage. (B) Histogram shows distribution of relative telomere length shown as telomere fluorescence intensity unit (TFU) in pig cells. Medium telomere length is shown as mean TFU ± SE. The medium telomere length (red bars) is also shown as mean ± SE in the upper right hand corner. Ds, telomere doublets; Chr, chromosomes. Black arrows on the Y-axis indicate frequency of telomere signal-free ends. (C) Representative image of mouse telomeres (green) by Q-FISH. Enlarged view at right. Blue, chromosomes. (D) Telomere distribution and length of mouse embryonic fibroblast at passage 3 (MEFP3).
Figure 3
Figure 3
Telomere length by metaphase Q-FISH analysis of various porcine cell types during subculture. (A) Telomere distribution and length from various pig cells during subculture. The medium telomere length (red bars) is also shown as mean ±SE in the upper right hand corner. Black arrows on the Y-axis indicate frequency of telomere signal-free ends. (B) Representative image of adult fibroblasts (AF) during subculture from early to late passage. Purple arrows, telomere doublets; Yellow arrows, telomere signal-free ends. (C) Quantification of telomerase activity of various pig cell types by ELLSA. *, p < 0.05; **, p < 0.01, compared to the earliest passage of the same cell type. (D) Frequency of telomere signal-free ends in 3 types of pig cells during subculture; n, number of telomeres counted; %, number of signal-free ends per chromatid. (E) Percentage of telomere doublets in 3 pig cell types during subculture; %, number of doublets per chromatid. *, p < 0.05; **, p < 0.01, compared to the earliest passage.
Figure 4
Figure 4
Optimization of telomere measurement of pig cells by quantitative real-time PCR analysis (qPCR). (A) Telomere primers for pig telomere amplification and 36B4 primers. Telomere primers for human and mouse telomere measurement by qPCR were described previously [23,24]. (B) Melting curve charts of human telomere primers and mouse telomere primers for pig telomere analysis, respectively. (C) Standard curves for pig telomere amplification, using human telomere primers and porcine 36B4, mouse telomere primers and porcine 36B4, respectively. Telomeres and 36B4 for standard curves were derived by serial dilution of a known quantity of genomic DNA isolated from spleen cells. hTel, primers for human telomere sequence amplification; mTel, primers for mouse telomere sequence amplification; E, amplification efficiency; CT, threshold cycle. Solid circle, telomeres; Hollow circle, 36B4 control.
Figure 5
Figure 5
Telomere measurements of pig cells shown as a T/S ratio by qPCR and its correlation with TRFs, and TFU by Q-FISH. (A) Average relative telomere length shown as T/S ratios of various cell pig cells and during passage by qPCR method. T, telomere; S, 36B4 single-copy gene. P, passage. *, p < 0.05; **, p < 0.01, compared to the earliest passage. (B) Correlation of telomere length between TFU by Q-FISH, T/S ratio by qPCR, and TRFs (kb) by Southern blot.
Figure 6
Figure 6
Telomere dysfunction is associated with cellular senescence in pig cells. (A) Morphology of adult fibroblasts (AF) during subculture by β-galactosidase staining. P, passage. Senescent cells are stained blue. (B) Quantification of senescent cells positive for β-galactosidase staining. (C) Relative expression levels by qPCR of the senescence-related genes, p53 and p21, in 3 types of pig cells during subculture. *, p < 0.05; **, p < 0.001, compared to the primary cells at the earliest passage. (D) P53 protein levels in different cell lines from early to late passages by immuno-blot analysis. β-actin served as loading control. (E) Representative images showing TIFs as DNA damage foci (white arrows) indicated by γ-H2AX foci at telomeres by IF-FISH. Nuclei, blue; Telomere, green; γ-H2AX, red. (F) Percentage of TIFs and γ-H2AX-positive nucleus in various pig cell types. In all, 100 cells were counted for each cell line. *, p < 0.05; **, p < 0.01, compared to the early passage of the same cell type.

Similar articles

Cited by

References

    1. Blackburn EH. Switching and signaling at the telomere. Cell. 2001;106:661–673. doi: 10.1016/S0092-8674(01)00492-5. - DOI - PubMed
    1. Palm W, de Lange T. How shelterin protects mammalian telomeres. Annu Rev Genet. 2008;42:301–334. doi: 10.1146/annurev.genet.41.110306.130350. - DOI - PubMed
    1. Moyzis RK, Buckingham JM, Cram LS, Dani M, Deaven LL, Jones MD, Meyne J, Ratliff RL, Wu JR. A highly conserved repetitive DNA sequence, (TTAGGG)n, present at the telomeres of human chromosomes. Proc Natl Acad Sci USA. 1988;85:6622–6626. doi: 10.1073/pnas.85.18.6622. - DOI - PMC - PubMed
    1. Meyne J, Ratliff RL, Moyzis RK. Conservation of the human telomere sequence (TTAGGG)n among vertebrates. Proc Natl Acad Sci USA. 1989;86:7049–7053. doi: 10.1073/pnas.86.18.7049. - DOI - PMC - PubMed
    1. Allsopp RC, Vaziri H, Patterson C, Goldstein S, Younglai EV, Futcher AB, Greider CW, Harley CB. Telomere length predicts replicative capacity of human fibroblasts. Proc Natl Acad Sci USA. 1992;89:10114–10118. doi: 10.1073/pnas.89.21.10114. - DOI - PMC - PubMed

Publication types

LinkOut - more resources