

Spatiotemporal evolution of early innate immune responses triggered by neural stem cell grafting
- PMID: 23241452
- PMCID: PMC3580486
- DOI: 10.1186/scrt147
Spatiotemporal evolution of early innate immune responses triggered by neural stem cell grafting
Abstract
Introduction: Transplantation of neural stem cells (NSCs) is increasingly suggested to become part of future therapeutic approaches to improve functional outcome of various central nervous system disorders. However, recently it has become clear that only a small fraction of grafted NSCs display long-term survival in the (injured) adult mouse brain. Given the clinical invasiveness of NSC grafting into brain tissue, profound characterisation and understanding of early post-transplantation events is imperative to claim safety and efficacy of cell-based interventions.
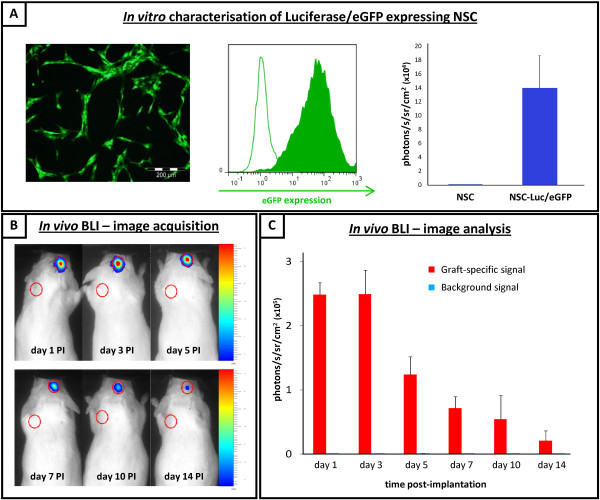
Methods: Here, we applied in vivo bioluminescence imaging (BLI) and post-mortem quantitative histological analysis to determine the localisation and survival of grafted NSCs at early time points post-transplantation.
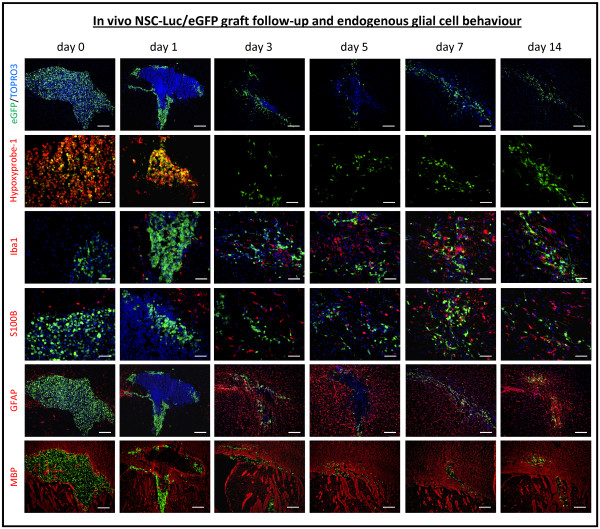
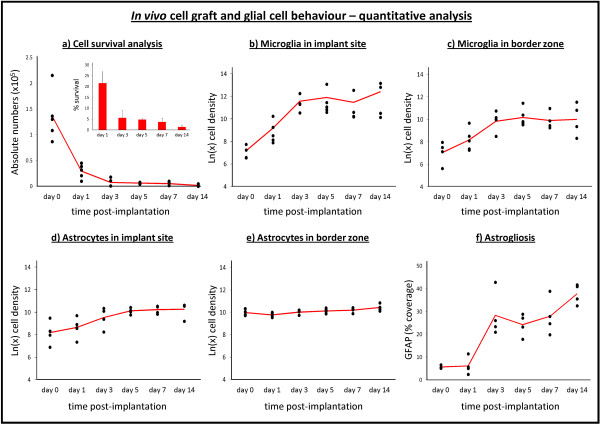
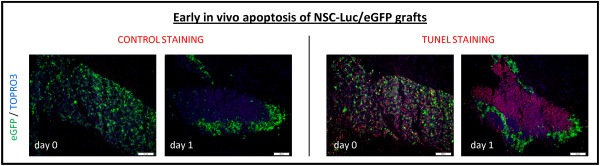
Results: An initial dramatic cell loss (up to 80% of grafted cells) due to apoptosis could be observed within the first 24 hours post-implantation, coinciding with a highly hypoxic NSC graft environment. Subsequently, strong spatiotemporal microglial and astroglial cell responses were initiated, which stabilised by day 5 post-implantation and remained present during the whole observation period. Moreover, the increase in astrocyte density was associated with a high degree of astroglial scarring within and surrounding the graft site. During the two-week follow up in this study, the NSC graft site underwent extensive remodelling with NSC graft survival further declining to around 1% of the initial number of grafted cells.
Conclusions: The present study quantitatively describes the early post-transplantation events following NSC grafting in the adult mouse brain and warrants that such intervention is directly associated with a high degree of cell loss, subsequently followed by strong glial cell responses.
Figures
Similar articles
-
Quantitative and phenotypic analysis of mesenchymal stromal cell graft survival and recognition by microglia and astrocytes in mouse brain.Immunobiology. 2013 May;218(5):696-705. doi: 10.1016/j.imbio.2012.08.266. Epub 2012 Aug 9. Immunobiology. 2013. PMID: 22944251
-
Clinical potential of intravenous neural stem cell delivery for treatment of neuroinflammatory disease in mice?Cell Transplant. 2011;20(6):851-69. doi: 10.3727/096368910X543411. Epub 2010 Nov 19. Cell Transplant. 2011. PMID: 21092405
-
Grafted Subventricular Zone Neural Stem Cells Display Robust Engraftment and Similar Differentiation Properties and Form New Neurogenic Niches in the Young and Aged Hippocampus.Stem Cells Transl Med. 2016 Sep;5(9):1204-15. doi: 10.5966/sctm.2015-0270. Epub 2016 May 18. Stem Cells Transl Med. 2016. PMID: 27194744 Free PMC article.
-
Current challenges for the advancement of neural stem cell biology and transplantation research.Stem Cell Rev Rep. 2012 Mar;8(1):262-78. doi: 10.1007/s12015-011-9266-2. Stem Cell Rev Rep. 2012. PMID: 21537994 Review.
-
Concise Review: Innate and Adaptive Immune Recognition of Allogeneic and Xenogeneic Cell Transplants in the Central Nervous System.Stem Cells Transl Med. 2017 May;6(5):1434-1441. doi: 10.1002/sctm.16-0434. Epub 2017 Feb 28. Stem Cells Transl Med. 2017. PMID: 28244236 Free PMC article. Review.
Cited by
-
The effects of harvesting media on biological characteristics and repair potential of neural stem cells after traumatic brain injury.PLoS One. 2014 Sep 23;9(9):e107865. doi: 10.1371/journal.pone.0107865. eCollection 2014. PLoS One. 2014. PMID: 25247595 Free PMC article.
-
Activating receptor NKG2D targets RAE-1-expressing allogeneic neural precursor cells in a viral model of multiple sclerosis.Stem Cells. 2014 Oct;32(10):2690-701. doi: 10.1002/stem.1760. Stem Cells. 2014. PMID: 24898518 Free PMC article.
-
In Vivo Fate Imaging of Intracerebral Stem Cell Grafts in Mouse Brain.PLoS One. 2015 Dec 7;10(12):e0144262. doi: 10.1371/journal.pone.0144262. eCollection 2015. PLoS One. 2015. PMID: 26641453 Free PMC article.
-
Persistent Quantitative Vitality of Stem Cell Graft Is Necessary for Stabilization of Functional Brain Networks After Stroke.Front Neurol. 2019 Apr 5;10:335. doi: 10.3389/fneur.2019.00335. eCollection 2019. Front Neurol. 2019. PMID: 31024429 Free PMC article.
-
The role of stem cell therapy in multiple sclerosis: An overview of the current status of the clinical studies.Adv Biomed Res. 2016 Mar 16;5:46. doi: 10.4103/2277-9175.178791. eCollection 2016. Adv Biomed Res. 2016. Retraction in: Adv Biomed Res. 2018 Sep 21;7:129. doi: 10.4103/2277-9175.241836. PMID: 27110543 Free PMC article. Retracted. Review.
References
Publication types
MeSH terms
Substances
LinkOut - more resources
Full Text Sources
