. 2013 Jan 15;190(2):641-9.
doi: 10.4049/jimmunol.1202448. Epub 2012 Dec 12.

The depletion of NK cells prevents T cell exhaustion to efficiently control disseminating virus infection

Affiliations

The depletion of NK cells prevents T cell exhaustion to efficiently control disseminating virus infection

Kevin D Cook et al. J Immunol. .

Abstract

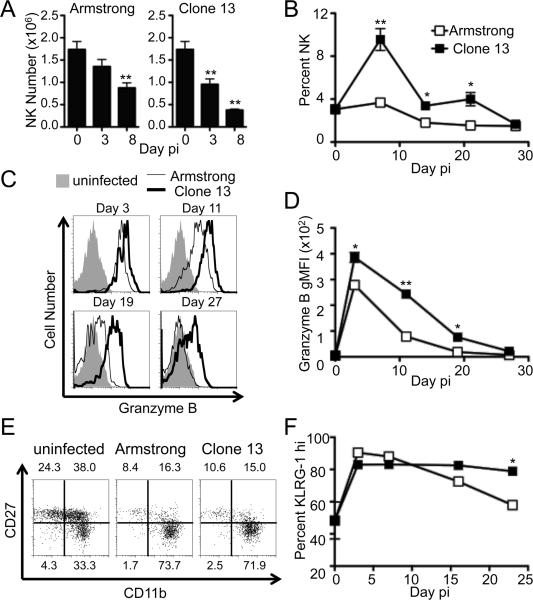
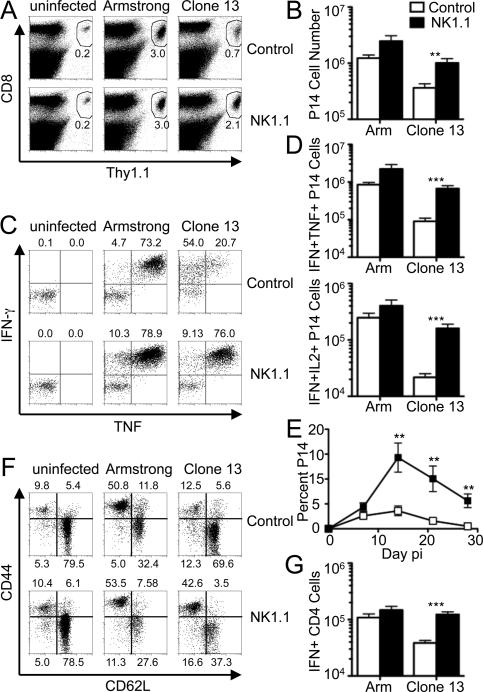
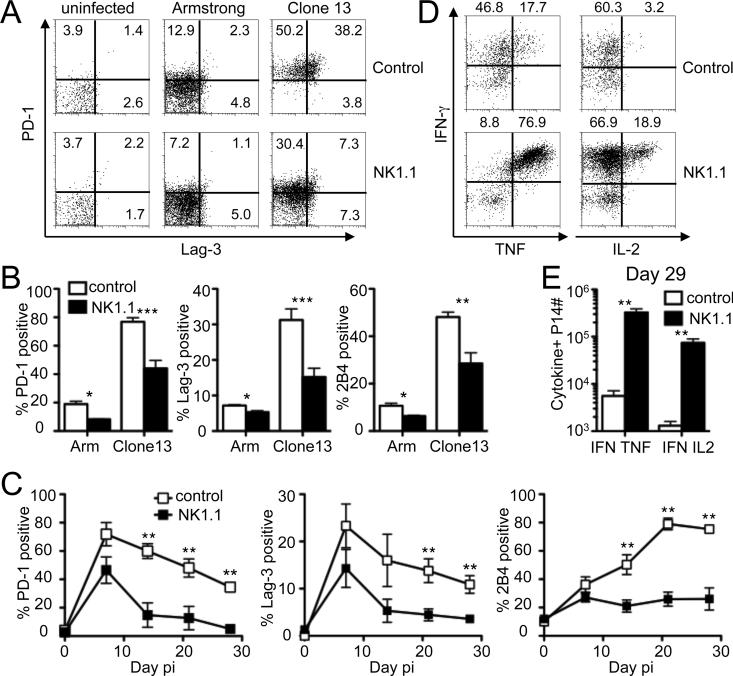
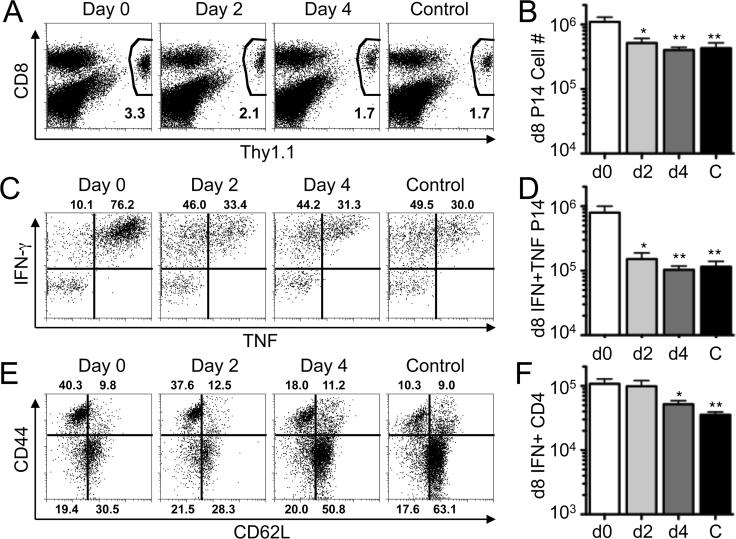
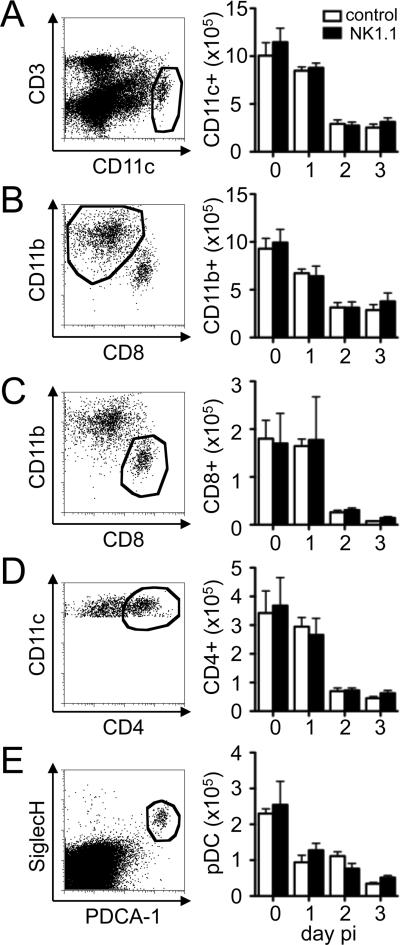
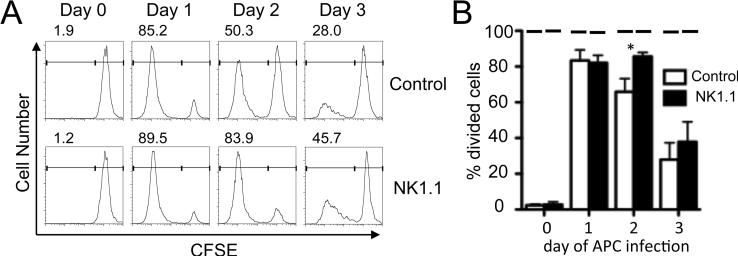
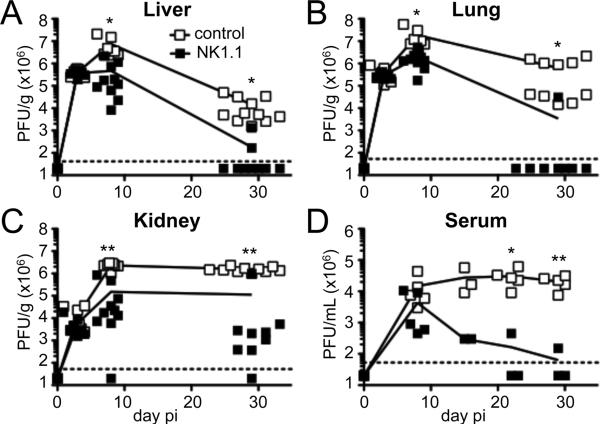
NK cells have well-established functions in immune defense against virus infections and cancer through their cytolytic activity and production of cytokines. In this study, we examined the frequency of NK cells and their influence on T cell responses in mice given variants of lymphocytic choriomeningitis virus that cause acute or persisting infection. We found increased frequencies of circulating NK cells during disseminating infection compared with uninfected or acutely infected mice. Consistent with recent reports, we observed that the depletion of NK cells in mice with disseminated infection increased peak numbers of virus-specific cytokine producing CD8(+) T cells and resulted in the rapid resolution of disseminated infection. Additionally, we show that NK cell depletion sustained T cell responses across time and protected against T cell exhaustion. The positive effects of NK cell depletion on T cell responses only occurred when NK cells were depleted within the first 2 d of infection. We find that the improved CD8(+) T cell response correlated with an enhanced ability of APCs from NK cell-depleted mice to stimulate T cell proliferation, independently of the effects of NK cells on CD4(+) T cells. These results indicate that NK cells play an integral role in limiting the CD8 T cell response and contribute to T cell exhaustion by diminishing APC function during persisting virus infection.


Figures

Figure 1
Figure 1. NK cell number during acute and chronic virus infection
Adult B6 mice were infected with the Armstrong or Clone 13 strain of LCMV. A) At days 0, 3, and 8 post-infection (pi), splenocytes were harvested, stained for NK cell markers, and analyzed by flow cytometry. The total number of NK1.1+ DX5+ NKp46+ splenic NK cells at the indicated days is depicted as mean + SEM, with N=4-13 over 5 experiments for Armstrong, and N=12-16 over 6 experiments for Clone13. The significant differences between the Armstrong and Clone13 infected mice relative to the uninfected samples are indicated. B) The frequency of NK cells within peripheral blood leukocytes was measured in mice bled repeatedly over time and is depicted as mean +/- SEM, with N=3-11 over 4 experiments for Armstrong, and N=6-10 over 4 experiments for Clone13. The asterisks indicate differences between Armstrong and Clone13 at each time. C-D) NK cells isolated from the blood were intracellularly stained for Granzyme B. The histograms show examples of the Granzyme B levels in NK cells from uninfected (shaded), Armstrong infected (thin line), and Clone 13 infected (thick line) mice at various time points after infection (C). The line graph shows the gMFI of Granzyme B in NK cells from each group over time, depicted as mean +/- SEM, with N=4 for each group from 2 experiments (D). E) NK cells isolated from the spleen at day 7 pi were stained for CD11b and CD27; the numbers indicate the frequency of NK cells within each quadrant. The dot plots are representative of 3 mice from 1 experiment. F) NK cells isolated from the blood were stained for KLRG-1. The line graph shows the percentage of NK cells that are KLRG-1 hi over time, depicted as mean +/- SEM, with N=3 from 1 experiment. Significant differences between Armstrong and Clone13 at each time are indicated by asterisks: * p<0.05, ** p<0.01, *** p<0.001.
Figure 2
Figure 2. NK cell depletion improves early T cell responses to chronic virus infection
2×10³ P14 T cells from Thy1.1+ mice were transferred to Thy1.2+ B6 mice; the mice were treated with NK1.1 or control antibody at days -2 & -3 and then infected with LCMV-Armstrong or Clone13. Uninfected mice were given 2×10⁶ P14 T cells to facilitate the detection of P14 cells. A) The dot plots identify P14 T cells in the spleens from uninfected mice or mice 8 days after infection; the numbers indicate the frequency of CD8+ Thy1.1+ P14 cells among all spleen cells. B) The total number of CD8+Thy1.1+ splenic P14 cells at day 8 pi, depicted as mean + SEM, with N=3 from 1 experiment for Armstrong, and N=11-14 over 5 experiments for Clone13. C) An example of IFNγ and TNF production by splenic P14 cells at day 8 pi after ex vivo stimulation with LCMV peptide GP33-41; the numbers above each plot indicate the percentage of IFNγ+TNF- and IFNγ+TNF+ cells among P14 cells. D) The total number of IFNγ+TNF+ (top) or IFNγ+IL-2+ (bottom) splenic P14 cells at day 8 pi, depicted as mean + SEM, with N=3 from 1 experiment for Armstrong, and N=11-14 over 5 experiments for Clone13. E) The frequency of P14 cells among blood leukocytes in mice that were bled repeatedly following infection with LCMV-Clone13 (mean +/- SEM; N = 6-10 from 4 experiments). F) CD4+ T cells from the spleen were stained for the activation markers CD62L and CD44. The numbers indicate the percentage of CD4 cells in each quadrant. G) The total number of IFNγ+ splenic CD4 cells at day 8 pi, as measured by intracellular cytokine staining, depicted as mean + SEM, N=6 for Armstrong across 2 experiments and N=11-14 across 5 experiments for Clone13. The asterisks indicate significant differences between control and NK1.1-treated groups: * p<0.05, ** p<0.01, *** p<0.001.
Figure 3
Figure 3. NK cell depletion reduces T cell exhaustion during chronic virus infection
2×10³ P14 T cells from Thy1.1+ mice were transferred to Thy1.2+ B6 mice; the mice were treated with NK1.1 or control antibody at days -2 & -3 and then infected with LCMV-Armstrong or Clone13. A-B) On day 8 post-infection, spleen cells were harvested and analyzed for several markers of exhaustion. A) Representative dot plots show the expression of PD-1 and Lag-3 on P14 T cells, while the numbers indicate the frequency of cells in each quadrant. B) Cumulative data are depicted by the bar graphs, which show the percent of splenic P14 cells that stained positive for PD-1 (left), Lag-3 (center), and 2B4 (right), represented as mean + SEM, with N=3 from 1 experiment for Armstrong and N=9-14 across 5 experiments for Clone13. C) The percent of peripheral blood P14 cells that stained positive for PD-1 (left), Lag-3 (center), and 2B4 (right) at various days after infection is depicted as mean +/- SEM, N=6 for each group from 2 experiments. D) An example of IFNγ and TNF (left) or IL-2 (right) production by splenic P14 cells at day 29 pi after ex vivo stimulation with LCMV peptide GP33-41; the numbers above each plot indicate the frequency of IFNγ+TNF- and IFNγ+TNF+ or IFNγ+IL-2- and IFNγ+IL-2+ P14 cells. E) The total number of IFNγ+TNF+ or IFNγ+IL-2+ splenic P14 cells at day 29, depicted as mean + SEM with N=8-9 over 3 experiments. Significant differences between control and NK1.1-treated samples are indicated: * p<0.05, ** p<0.01, *** p<0.001.
Figure 4
Figure 4. The effects of NK cell depletion on T cells occur early after infection
2×10³ P14 T cells from Thy1.1+ mice were transferred to Thy1.2+ B6 mice; the mice were treated with control antibody or NK1.1 on either days 0, 2 or 4 of the infection with LCMV-Clone13. A) The dot plots identify P14 T cells in the spleens of mice 8 days after infection; the numbers indicate the percentage of CD8+ Thy1.1+ P14 cells among all spleen cells. B) The total number of CD8+Thy1.1+ splenic P14 cells at day 8 pi, depicted as mean + SEM, N=4-7 for each group over 3 experiments. C) An example of IFNγ and TNF production by splenic P14 cells at day 8 pi after ex vivo stimulation with LCMV peptide GP33-41; the numbers above each plot indicate the percentage of IFNγ+TNF- and IFNγ+TNF+ cells among P14 cells. D) The total number of IFNγ+TNF+ splenic P14 cells at day 8 pi, depicted as mean + SEM, N=4-7 for each group over 3 experiments. E) CD4+ T cells from the spleen were stained for the activation markers CD62L and CD44. The numbers indicate the frequency of CD4 cells in each quadrant. F) The total number of IFNγ+ splenic CD4 cells at day 8 pi, as measured by intracellular cytokine staining, depicted as mean + SEM, n=4-7 for each group over 3 experiments. Significant differences between day 0 NK1.1 treatment and all other samples are indicated: * p<0.05, ** p<0.01.
Figure 5
Figure 5. NK cell depletion does not affect the number of splenic DCs
Adult B6 mice were infected with LCMV-Clone13. At days 0, 1, 2, and 3 after infection, splenocytes were harvested, stained for DC cell markers, and analyzed by flow cytometry. The dot plots shows examples of the staining used to identify CD11c+CD3- DCs (A), CD11b+ DCs (B), CD8+ DCs (C), CD4+ DCs (D), and pDCs (E). Samples A and E depict all spleen cells, while samples B, C, and D were gated on CD11c+CD3- DCs. The bar graphs display the total number of the indicated DC subsets and are depicted as mean + SEM, N=3-8 for each group over 3 experiments.
Figure 6
Figure 6. APCs from infected mice depleted of NK cells show improved capacity to stimulate T cell proliferation
Naïve P14 T cells from Thy1.1+ mice were stained with CFSE and incubated with splenocytes from day 0, 1, 2, or 3 LCMV-Clone13 infected B6 mice at a ratio of 1:20. The splenocytes were from mice that had been treated with NK1.1 or control antibody at days -2 & -3 before infection. A) The histograms are gated on the CD8+Thy1.1+ P14 cells and show their dilution of CFSE on day 5 of the in vitro culture. The numbers indicate the percentage of P14 cells that had divided more than once. B) The bar graphs display the percentage of the P14 cell population that had divided in the absence of exogenous peptide and is depicted as mean + SEM, N=3-5 for each group over 3 experiments. The short lines above each bar indicate the percentage of divided cells after addition of 1 μM of LCMV peptide GP33-41 at the beginning of the culture. The asterisk indicates a significant difference (P<0.05) between control and NK1.1-treated samples.
Figure 7
Figure 7. The depletion of NK cells improves viral clearance
2×10³ P14 T cells from Thy1.1+ mice were transferred to Thy1.2+ B6 mice; the mice were treated with NK1.1 or control antibody at days -2 & -3 and then infected with LCMV-Clone13. The level of virus infection was determined by plaque assay from (A-C) liver, lung, and kidney tissues isolated from mice harvested on days 3, 8, or 29 pi and (D) serum samples isolated from mice bled repeatedly over time. The solid line shows the average titers for each group; the dashed line represents the limit of detection. Significant differences between control and NK1.1-treated samples are indicated: * P<0.05, ** P<0.01 (N=7-11 over 4 experiments in A-C ; N=3-5 over 2 experiments in D).

Similar articles

Cited by

References

    1. Khakoo SI, Thio CL, Martin MP, Brooks CR, Gao X, Astemborski J, Cheng J, Goedert JJ, Vlahov D, Hilgartner M, Cox S, Little AM, Alexander GJ, Cramp ME, O'Brien SJ, Rosenberg WM, Thomas DL, Carrington M. HLA and NK cell inhibitory receptor genes in resolving hepatitis C virus infection. Science. 2004;305:872–874. - PubMed
    1. Seich Al Basatena NK, Macnamara A, Vine AM, Thio CL, Astemborski J, Usuku K, Osame M, Kirk GD, Donfield SM, Goedert JJ, Bangham CR, Carrington M, Khakoo SI, Asquith B. KIR2DL2 enhances protective and detrimental HLA class I-mediated immunity in chronic viral infection. PLoS pathogens. 2011;7:e1002270. - PMC - PubMed
    1. Martin MP, Gao X, Lee JH, Nelson GW, Detels R, Goedert JJ, Buchbinder S, Hoots K, Vlahov D, Trowsdale J, Wilson M, O'Brien SJ, Carrington M. Epistatic interaction between KIR3DS1 and HLA-B delays the progression to AIDS. Nat Genet. 2002;31:429–434. - PubMed
    1. Alter G, Heckerman D, Schneidewind A, Fadda L, Kadie CM, Carlson JM, Oniangue-Ndza C, Martin M, Li B, Khakoo SI, Carrington M, Allen TM, Altfeld M. HIV-1 adaptation to NK-cell-mediated immune pressure. Nature. 2011;476:96–100. - PMC - PubMed
    1. Biron CA, Nguyen KB, Pien GC, Cousens LP, Salazar-Mather TP. Natural killer cells in antiviral defense: function and regulation by innate cytokines. Annual review of immunology. 1999;17:189–220. - PubMed

Publication types

MeSH terms

Substances