. 2013 Feb;31(2):283-91.
doi: 10.3892/ijmm.2012.1212. Epub 2012 Dec 13.

B7-H3 overexpression in pancreatic cancer promotes tumor progression

Affiliations

B7-H3 overexpression in pancreatic cancer promotes tumor progression

Xin Zhao et al. Int J Mol Med. 2013 Feb.

Abstract

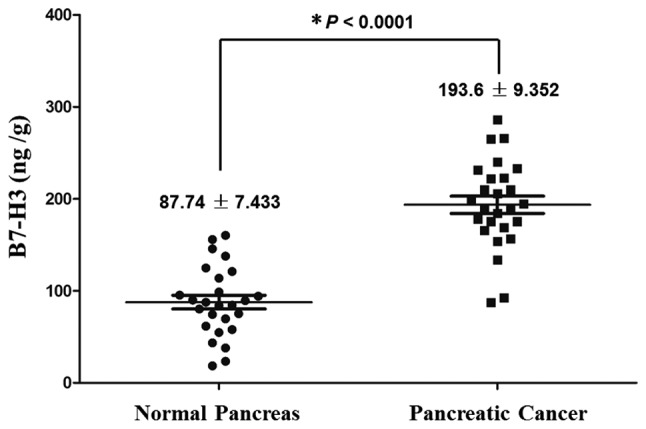
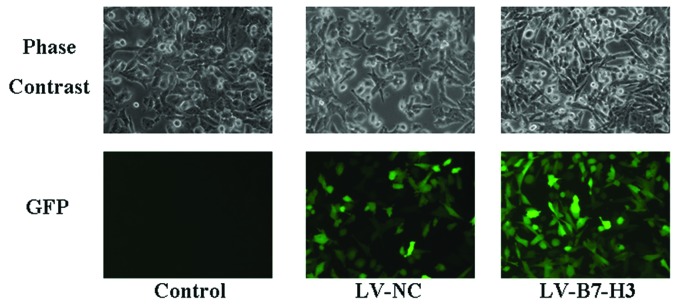
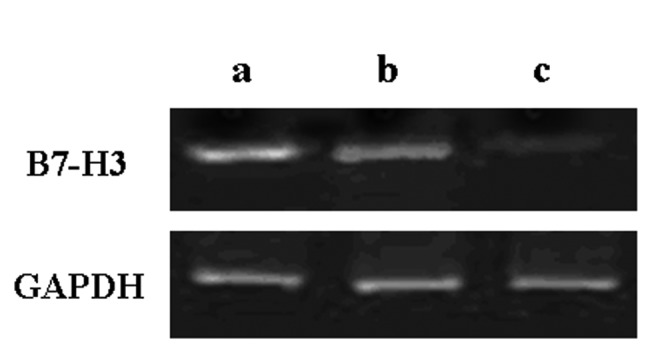
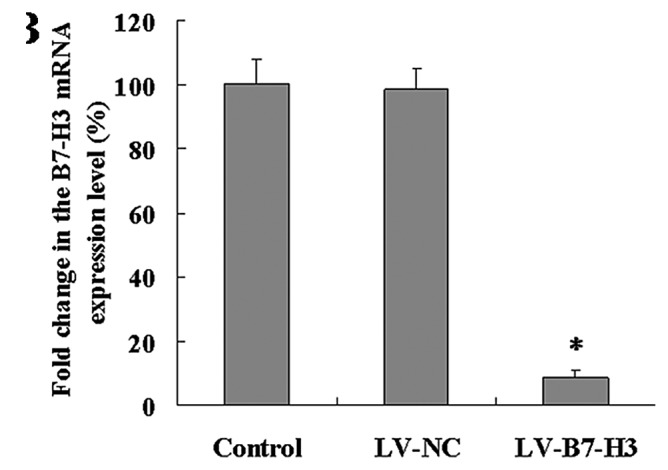
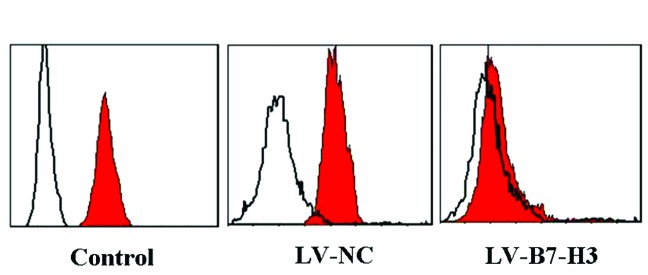
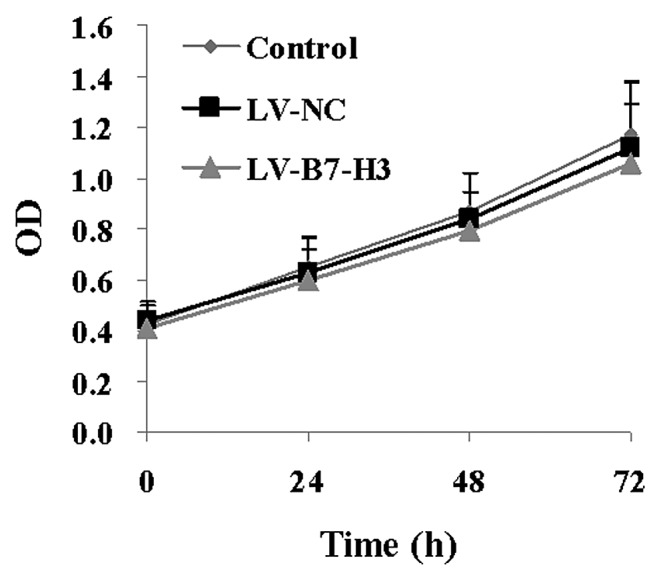
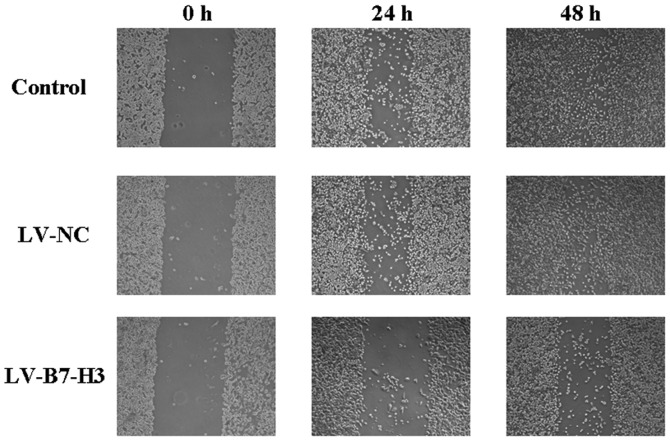
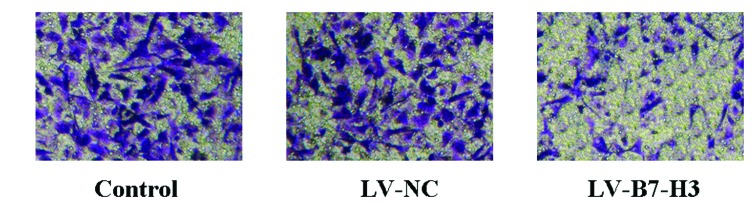
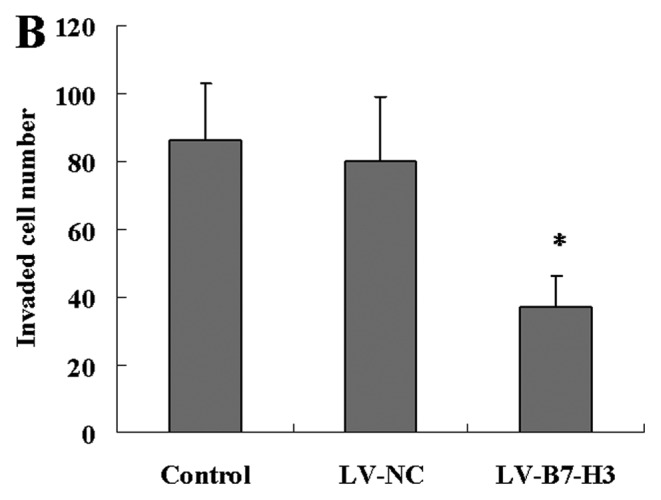
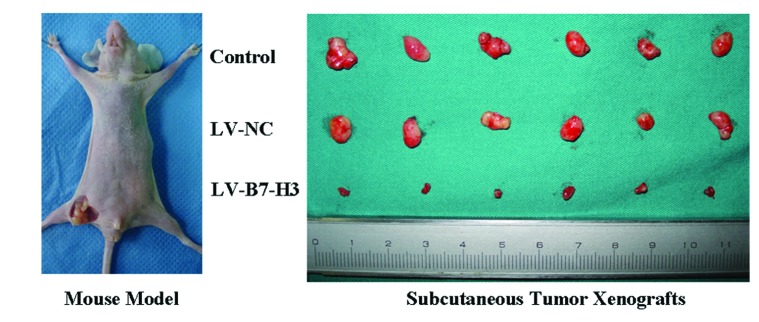
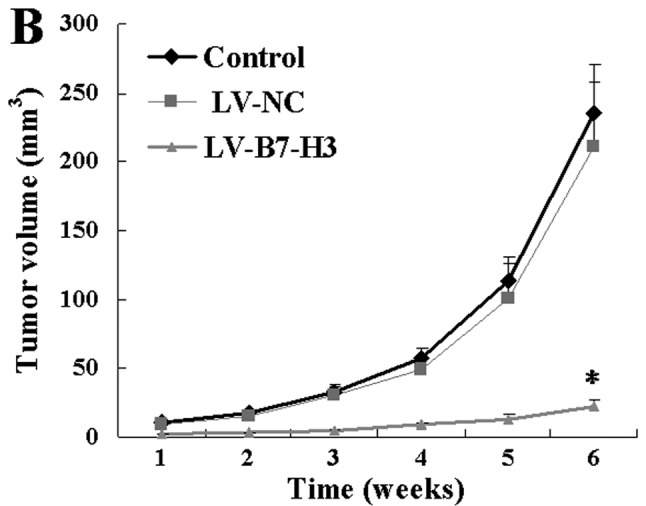
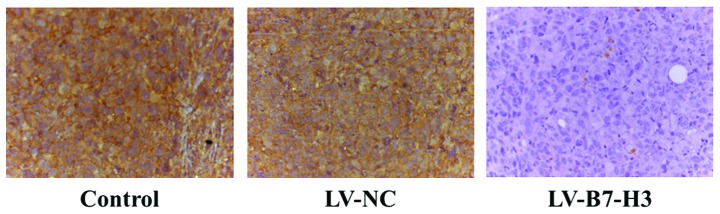
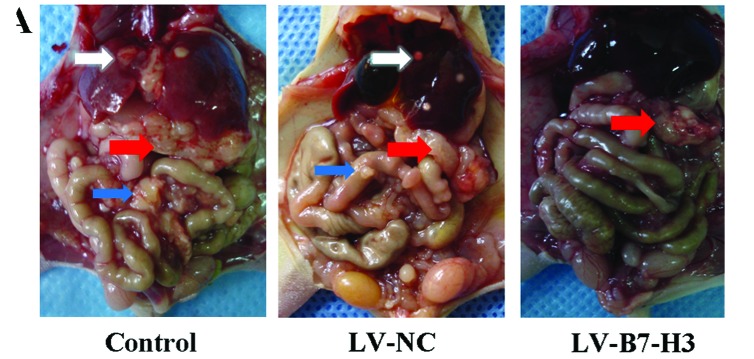
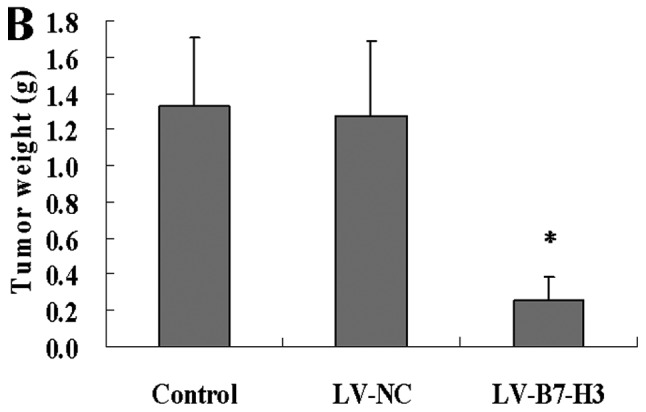
B7-H3, a member of the B7-family molecules, plays an important role in adaptive immune responses. In addition, B7-H3 is also expressed in several types of human cancers and is correlated with the poor outcome of cancer patients. However, its exact role in cancer is not known. In the present study, we compared B7-H3 expression in normal pancreas and pancreatic cancer tissue specimens, and determined the effects of low B7-H3 expression on the human pancreatic cancer cell line Patu8988 using lentivirus-mediated RNA interference. B7-H3 expression in pancreatic specimens was determined by enzyme-linked immunosorbent assay (ELISA). A Patu8988 cell line with low B7-H3 expression was established by lentivirus-mediated RNA interference to investigate the effect of B7-H3 on cell proliferation, migration and invasion in vitro. By establishing subcutaneous transplantation tumor and orthotopic transplantation pancreatic cancer mouse models, the effect of B7-H3 on cell proliferation, migration and invasion was studied in vivo. B7-H3 in tissue samples was significantly higher in the pancreatic cancer group than in the normal pancreas group (mean ± SD, 193.6±9.352 vs. 87.74±7.433 ng/g; P<0.0001). B7-H3 knockdown by RNA interference decreased cell migration and Transwell invasion up to 50% in vitro. No apparent impact was observed on cell proliferation in vitro. In the subcutaneous transplantation tumor mouse model, the tumor growth rate was reduced by the knockdown of B7-H3. In the orthotopic transplantation pancreatic cancer mouse model, the effect of inhibiting metastasis by knocking down B7-H3 was assessed in terms of the average postmortem abdominal visceral metastatic tumor weight. This demonstrated that inhibition of B7-H3 expression reduced pancreatic cancer metastasis in vivo. In conclusion, B7-H3 is aberrantly expressed in pancreatic cancer. In addition to modulating tumor immunity, B7-H3 may have a novel role in regulating pancreatic tumor progression.


Figures

Figure 1
Figure 1
B7-H3 was significantly higher in pancreatic cancer than in normal pancreas tissue samples. (*P<0.0001, pancreatic cancer vs. normal pancreas).
Figure 2
Figure 2
Immunohistochemical staining for B7-H3 in clinical specimens. (A) Low expression in normal pancreas. (B) Overexpression in pancreatic cancer tissue. (Magnification, ×200).
Figure 3
Figure 3
Efficiency of infection as detected by GFP expression using fluorescence microscopy. Patu8988 cells were infected with lentivirus LV-B7-H3 and lentivirus LV-NC, respectively. Phase contrast and GFP expression were assessed under a fluorescence microscope. (Magnification, ×200).
Figure 4
Figure 4
Silencing effect of B7-H3. (A) RT-PCR of B7-H3 mRNA in the 3 groups was performed with GAPDH as the loading control (lane a, control; lane b, LV-NC; lane c, LV-B7-H3). B7-H3 mRNA in the LV-B7-H3 group was knocked down vs. the other 2 groups. (B) The knockdown effect of B7-H3 mRNA by real-time RT-PCR. Relative expression of B7-H3 mRNA level was analyzed using the 2−ΔΔCt method. B7-H3 mRNA expression was significantly inhibited in the LV-B7-H3 group (*P<0.01 vs. the control group). (C) The knockdown effect of B7-H3 protein by FCM. The protein expression level of B7-H3 in the LV-B7-H3 group was obviously downregulated vs. that of the other 2 groups (P<0.01).
Figure 4
Figure 4
Silencing effect of B7-H3. (A) RT-PCR of B7-H3 mRNA in the 3 groups was performed with GAPDH as the loading control (lane a, control; lane b, LV-NC; lane c, LV-B7-H3). B7-H3 mRNA in the LV-B7-H3 group was knocked down vs. the other 2 groups. (B) The knockdown effect of B7-H3 mRNA by real-time RT-PCR. Relative expression of B7-H3 mRNA level was analyzed using the 2−ΔΔCt method. B7-H3 mRNA expression was significantly inhibited in the LV-B7-H3 group (*P<0.01 vs. the control group). (C) The knockdown effect of B7-H3 protein by FCM. The protein expression level of B7-H3 in the LV-B7-H3 group was obviously downregulated vs. that of the other 2 groups (P<0.01).
Figure 5
Figure 5
Cell proliferation as assessed by MTT. Data are expressed as the means ± SD of 3 independent experiments in triplicates (OD, optical density). Curves of cell growth after infection for 24, 48 and 72 h were established by MTT assay. There was no statistically significance difference in cell proliferation between the LV-B7-H3 and the control group (P>0.05).
Figure 6
Figure 6
Cell migration as detected by wound scrape assay in vitro. Cells were damaged by mechanical scraping. Representative monolayer images of cell migration in the wound scrape model at 0, 24 and 48 h are shown. (Magnification, ×200).
Figure 7
Figure 7
Cell invasive ability as detected by Transwell assay. (A) Representative images of invading cells. (Magnification, ×100). (B) The number of invading cells are expressed as the mean ± SD of 3 independent experiments. (*P<0.05, LV-B7-H3 group vs. the control group).
Figure 7
Figure 7
Cell invasive ability as detected by Transwell assay. (A) Representative images of invading cells. (Magnification, ×100). (B) The number of invading cells are expressed as the mean ± SD of 3 independent experiments. (*P<0.05, LV-B7-H3 group vs. the control group).
Figure 8
Figure 8
Tumor growth in the subcutaneous transplantation mouse model. (A) A subcutaneous transplantation mouse model was established, and subcutaneous transplantation xenografts were excised after 6 weeks. (B) Growth curves of pancreatic cancer subcutaneous xenografts in nude mice are shown. Each group consisted of 6 mice, and the data are expressed as means ± SD. The tumor volume of the LV-B7-H3 group was obviously smaller (*P<0.01, vs. the control group).
Figure 8
Figure 8
Tumor growth in the subcutaneous transplantation mouse model. (A) A subcutaneous transplantation mouse model was established, and subcutaneous transplantation xenografts were excised after 6 weeks. (B) Growth curves of pancreatic cancer subcutaneous xenografts in nude mice are shown. Each group consisted of 6 mice, and the data are expressed as means ± SD. The tumor volume of the LV-B7-H3 group was obviously smaller (*P<0.01, vs. the control group).
Figure 9
Figure 9
Immunohistochemical staining for B7-H3 in subcutaneous xenotransplantation tumors. Xenografts from the LV-NC and the control group showed distinct membranous and cytoplasmic immunoreactivity for B7-H3, while xenografts from the LV-B7-H3 group showed weak B7-H3 expression. (Magnification, ×400).
Figure 10
Figure 10
Metastatic tumors in the orthotopic transplantation pancreatic cancer mouse model. (A) An orthotopic transplantation pancreatic cancer mouse model was established. Orthotopic pancreatic cancer tumors, liver metastatic tumors and abdominal cavity metastatic tumors are indicated by red, white and blue arrows, respectively. (B) Seven weeks after the orthotopic transplantation operation, metastatic visceral tumors out of the pancreas were excised and weighed. Each group consisted of 6 animals, and the data are presented as means ± SD. The tumor weight of the LV-B7-H3 group was obviously lower when compared with the LV-NC and control group (*P<0.01 vs. the control group).
Figure 10
Figure 10
Metastatic tumors in the orthotopic transplantation pancreatic cancer mouse model. (A) An orthotopic transplantation pancreatic cancer mouse model was established. Orthotopic pancreatic cancer tumors, liver metastatic tumors and abdominal cavity metastatic tumors are indicated by red, white and blue arrows, respectively. (B) Seven weeks after the orthotopic transplantation operation, metastatic visceral tumors out of the pancreas were excised and weighed. Each group consisted of 6 animals, and the data are presented as means ± SD. The tumor weight of the LV-B7-H3 group was obviously lower when compared with the LV-NC and control group (*P<0.01 vs. the control group).

References

    1. Jemal A, Siegel R, Ward E, et al. Cancer statistics, 2007. CA Cancer J Clin. 2007;57:43–66. - PubMed
    1. Neoptolemos JP, Cunningham D, Friess H, et al. Adjuvant therapy in pancreatic cancer: historical and current perspectives. Ann Oncol. 2003;14:675–692. - PubMed
    1. Hidalgo M. Pancreatic cancer. N Engl J Med. 2010;362:1605–1617. - PubMed
    1. Ghaneh P, Costello E, Neoptolemos JP, et al. Biology and management of pancreatic cancer. Postgrad Med J. 2008;84:478–497. - PubMed
    1. Pan X, Sheng W, Zhu Q, et al. Inhibition of pancreatic carcinoma growth by adenovirus-mediated human interleukin-24 expression in animal model. Cancer Biother Radiopharm. 2008;23:425–434. - PubMed

Publication types