. 2013 Jan;15(1):113-22.
doi: 10.1038/ncb2638. Epub 2012 Dec 16.

The ontogeny of cKIT+ human primordial germ cells proves to be a resource for human germ line reprogramming, imprint erasure and in vitro differentiation

Affiliations

The ontogeny of cKIT+ human primordial germ cells proves to be a resource for human germ line reprogramming, imprint erasure and in vitro differentiation

Sofia Gkountela et al. Nat Cell Biol. 2013 Jan.

Abstract

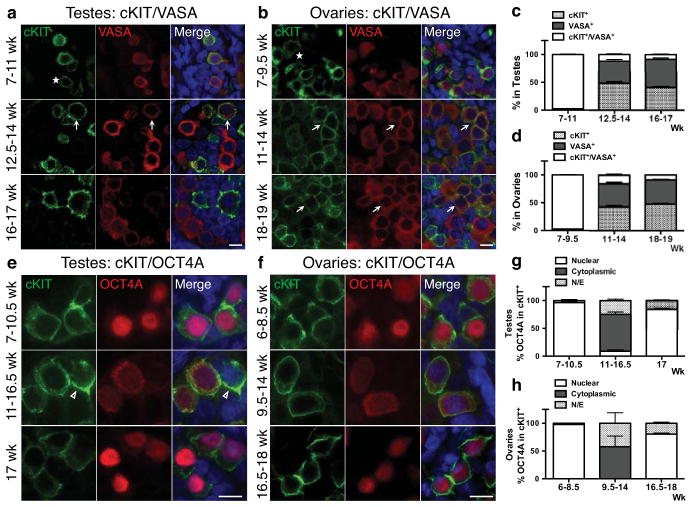
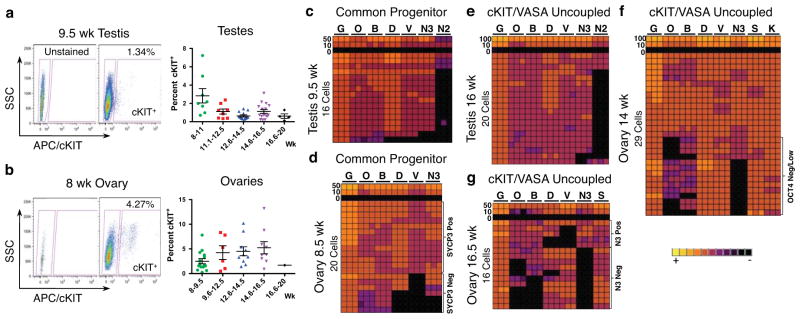
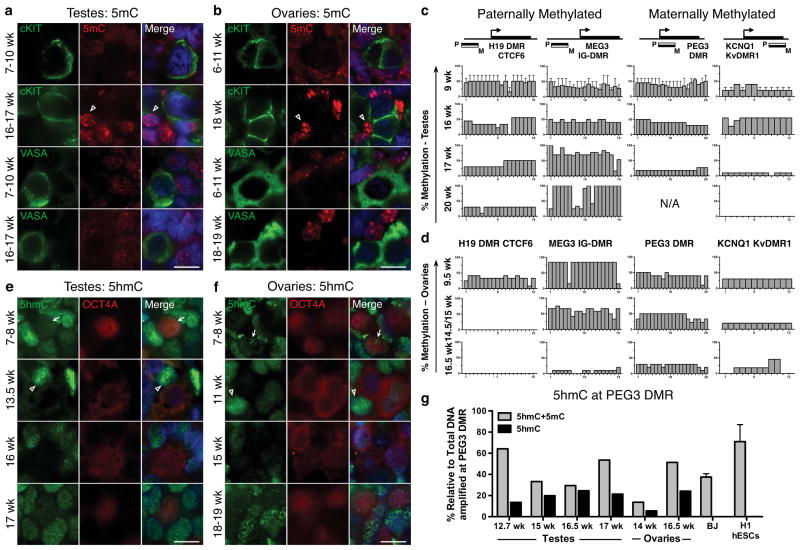
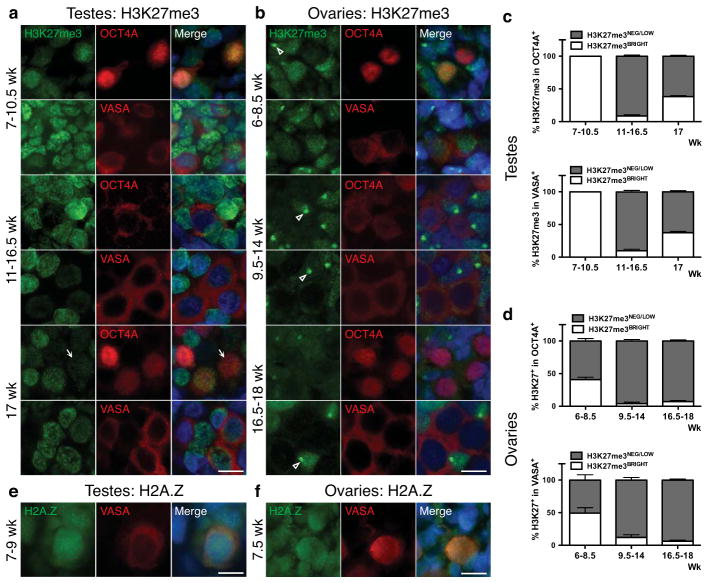
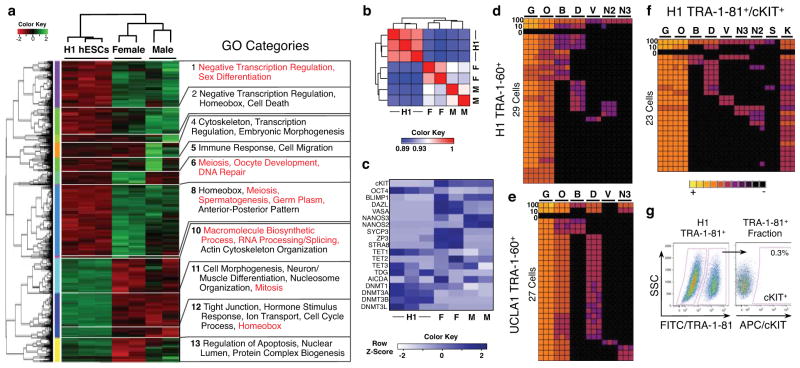
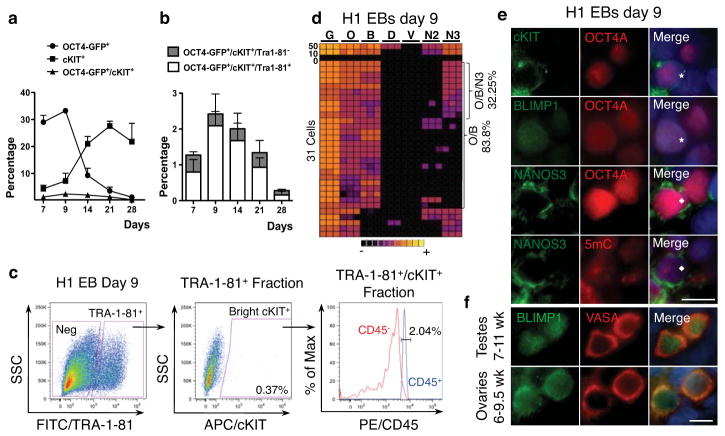
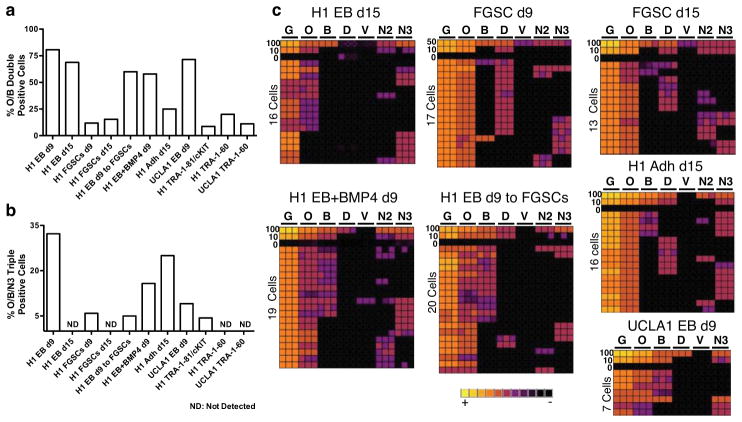
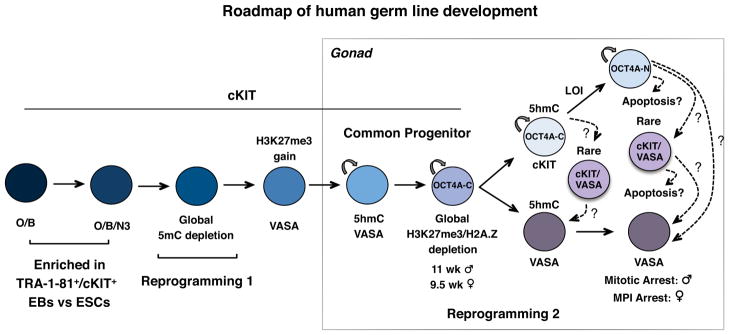
The generation of research-quality, clinically relevant cell types in vitro from human pluripotent stem cells requires a detailed understanding of the equivalent human cell types. Here we analysed 134 human embryonic and fetal samples from 6 to 20 developmental weeks and identified the stages at which cKIT(+) primordial germ cells (PGCs), the precursors of gametes, undergo whole-genome epigenetic reprogramming with global depletion of 5mC, H3K27me3 and H2A.Z, and the time at which imprint erasure is initiated and 5hmC is present. Using five alternative in vitro differentiation strategies combined with single-cell microfluidic analysis and a bona fide human cKIT(+) PGC signature, we show the stage of cKIT(+) PGC formation in the first 16 days of differentiation. Taken together, our study creates a resource of human germ line ontogeny that is essential for future studies aimed at in vitro differentiation and unveiling the mechanisms necessary to pass human DNA from one generation to the next.


Conflict of interest statement

COMPETING FINANCIAL INTERESTS

The authors declare no conflict of interest.

Figures

Fig. 1
Fig. 1
The dynamics of cKIT, OCT4A and VASA expression in the fetal gonad. (a,b) Representative immunofluorescence images of cKIT with VASA at the developmental weeks indicated. Asterisks indicate cKIT dim cells. (a) Shown is a 10-week testis for 7–11wk (n=5), a 13.5-week testis for 12.5–14wk (n=3) and a 16-week testis for 16–17wk (n=2). (b) Shown is a 7-week ovary for 7–9.5wk (n=4), an 11-week ovary for 11–14wk (n=3), and an 18-week ovary for 18–19wk (n=2). (c,d) Quantification of cKIT+, VASA+ and cKIT+/VASA+ cells (arrows in a,b). (c) In testes, 9 optic fields were counted at 7–11wk (n=5), 9 optic fields at 12.5–14wk (n=3) and 7 optic fields at 16–17wk (n=2). (d) In ovaries, 7 optic fields were counted at 7–9.5wk (n=4), 8 optic fields at 11–14wk (n=3) and 7 optic fields at 18–19wk (n=3). (e,f) Representative immunofluorescence images of cKIT with OCT4A at the developmental weeks indicated. (e) Shown is a 10-week testis for 7–10.5wk (n=5), a 13.5-week testis for 11–16.5wk (n=4) and a 17-week testis (n=1). (f) Shown is an 8-week for 6–8.5wk (n=3), an 11-week for 9.5–14wk (n=3) and an 18-week for 16.5–18wk (n=2). (g,h) Quantification of nuclear or cytoplasmic localization of OCT4A in cKIT+ cells. (g) In testes, 6 optic fields were counted at 7–10.5wk (n=5), 8 optic fields at 11–16.5wk (n=4) and 6 optic fields at 17wk (n=1). (h) In ovaries, 6 optic fields were counted at 7–8.5wk (n=3), 8 optic fields at 9.5–14wk (n=3) and 9 optic fields at 16.5–18wk (n=2). For immunofluorescence, nuclei were counterstained with DAPI (blue) and scale bars represent 10 um. All data are expressed as mean ± SEM. Abbreviations: wk= week, N/E= Not Expressed.
Fig. 2
Fig. 2
Molecular characterization of cKIT+ PGCs from 7–20 developmental weeks. (a,b) Gating strategy for sorting cKIT+ cells with an APC conjugated anti-human cKIT primary antibody against side scatter (SSC). (a) Shown is a 9.5-week testis and (b) an 8-week ovary. Also shown is the percent of cKIT+ cells sorted from the live fraction of testes in (a) and ovaries in (b) at 8–20 developmental weeks (wk). Each data point represents a single sample (biological replicate). All data are represented as mean ± SEM. (c–g) Heat map of GAPDH (G), OCT4 (O), BLIMP1 (B), DAZL (D), VASA (V), NANOS3 (N3), cKIT (K) NANOS2 (N2) and SYCP3 (S) in triplicate (columns) in 100, 50, 10, 0 or single sorted cKIT+ cells (rows).
Fig. 3
Fig. 3
Global loss of 5mC precedes loss of 5hmC (a,b) Representative immunofluorescence images shown of 5mC with cKIT or with VASA in (a) testes and (b) ovaries at the developmental weeks indicated. Open arrowheads indicate 5mC signal in somatic cells. (a) Shown is a 10-week testis for 7–10wk (n=3) and a 17-week testis for 16–17wk (n=3). (b) Shown is an 8-week ovary for 6–11wks (n=3) and an 18-week ovary for 18–19wk (n=2). (c,d) BS-PCR analysis of H19, MEG3, PEG3 and KCNQ1 in cKIT+ PGCs sorted from (c) testes at 9wk (n=2) and at 16, 17 and 20 weeks, and (d) ovaries at 9.5, 14.5, 15 and 16.5 weeks. (e,f) Representative immunofluorescence images of 5hmC with OCT4A in (e) testes and (f) ovaries at the developmental stages indicated in weeks. Arrows indicate 5hmC signal in PGCs, open arrowheads indicate 5hmC signal in somatic cells. (e) Shown is an 8-week testis for 7–8wk (n=2), a 13.5-week testis (n=1) a 16-week testis (n=2) and a 17-week testis (n=1). (f) Shown is an 8-week ovary for 7–8wk (n=2), an 11-week ovary, (n=1), 15-week ovary (n=1) and an 18-week ovary for 18–19 (n=2). (g) CGRA of the PEG3 DMR showing the percent of total methylation (5mC+5hmC) or 5hmC alone, relative to total amplified DNA (uncut) at the PEG3 DMR. DNA from BJ fibroblast and H1 hESCs were used as a negative control (for each, n=2 biological replicates). For immunofluorescence analysis nuclei were counterstained with DAPI (blue). Scale bars represent 10 um. All data are represented as mean ± SEM. Abbreviations: N/A= Not Amplified, wk= week.
Fig. 4
Fig. 4
Epigenetic reprogramming of H3K27me3 and H2A.Z occurs in the common PGC progenitor. (a,b) Representative immunofluorescence images of H3K27me3 with OCT4A or VASA in (a) testes from 7–17 weeks, and (b) ovaries from 6–18 weeks. (a) Shown is a 10.5-week testis for 7–10.5wk (n=3), a 16.5-week testis for 11–16wk (n=7) and a 17-week testis (n=1). Arrow indicates PGC nucleus with H3K27me3Low levels at 17wk relative to the intensity of staining in the somatic neighbors in the same section (b) Shown is a 7-week for 6–8.5wk (n=3), an 11-week for 9.5–14wk (n=4), and an 18-week for 16.5–18wk (n=3). Open arrowhead indicates strong H3K27me3 accumulation that is indicative of X chromosome inactivation. (c,d) Quantification of H3K27me3 in OCT4A+ or VASA+ germ cells in (c) testes and (d) ovaries, at the developmental ages indicated. (c) In testes for quantification in OCT4A+, 6 optic fields were counted at 7–10.5wk (n=3), 14 optic fields at 11–16.5wk (n=7) and 6 optic fields at 17wk (n=1). For quantification in VASA+, 6 optic fields were counted at 7–10.5wk (n=3), 10 optic fields at 11–16.5wk (n=7) and 6 optic fields at 17wk (n=1). (d) In ovaries, for quantification in OCT4A+, 6 optic fields were counted at 6–8.5wk (n=3), 10 optic fields at 9.5–14wk (n=4) and 8 optic fields at 16.5–18wk (n=3). For quantification in VASA+, 4 optic fields were counted at 6–8.5wk (n=3), 10 optic fields at 9.5–14wk (n=4) and 7 optic fields at 16.5–18wk (n=3). (e,f) Representative immunofluorescence images of H2A.Z with VASA in testes (e) from 7–9 weeks, and ovary (f) at 7.5 weeks. (e) Shown is a 9-week testis for 7–9wk (n=2) and (f) at 7.5-week ovary (n=2). For immunofluorescence, nuclei were counterstained with DAPI (blue). Scale bars represent 10 um. Data are represented as mean ± SEM. Abreviations: wk= weeks.
Fig. 5
Fig. 5
RNA-Seq reveals the transcriptional identity of cKIT+ PGCs. Single cell analysis of hESCs shows stochastic expression of germ line genes. (a) Heat map of 5,455 differentially expressed genes (p value < 0.05) in at least one of three comparisons (male cKIT+ vs H1 hESCs; female cKIT+ vs H1 hESCs; male cKIT+ vs. female cKIT+). The enriched GO terms in the 13 resulting clusters are shown. (b) Heat map of Pearson Correlation Coefficient scores between hESCs and cKIT+ male and female PGCs. (c) Heat map of FKPM values for selected genes in hESCs and cKIT+ male and female PGCs. Abbreviations: M= Male, F= Female. (d,e) Heat map of GAPDH (G), OCT4 (O), BLIMP1 (B), DAZL (D), VASA (V), NANOS3 (N3) and NANOS2 (N2) for H1 hESCs in triplicate (columns) in 100, 10, 0 or single TRA-1-60+ cells (rows) sorted from H1 (d) and UCLA1 (e) hESCs. (f) Heat map as in d and e plus cKIT (K) for TRA-1-81+/cKIT+ H1 hESCs. (g) Gating strategy to sort TRA-1-81+/cKIT+ cells from the H1 hESC line. cKIT+ cells are gated from the TRA-1-81+ fraction, using a FITC secondary antibody against side scatter (SSC).
Fig. 6
Fig. 6
In vitro hESC differentiation generates rare germ line progenitors that are cKIT/TRA-1-81 positive. (a) Percentage of OCT4-GFP+, cKIT+ and total OCT4-GFP+/cKIT+ generated upon adherent differentiation for the indicated time points. (b) Percentage of TRA-1-81+ and TRA-1-81 cells within the OCT4-GFP+/cKIT+ population generated by adherent differentiation of H1 OCT4-GFP for the indicated time points. TRA-1-81 is co-expressed by the majority of cKIT/OCT4-GFP double positive cells upon hESC differentiation. (c) Gating strategy to sort cKIT+/TRA-1-81+ cells (shown are H1-EBs differentiated for 9 days). cKIT+ cells are gated from the TRA-1-81+ fraction. Flow cytometry for CD45 in the TRA-1-81+/cKIT+ cells reveals <3% contamination by CD45 positive cells. (d) Heat map of GAPDH (G), OCT4 (O), BLIMP1 (B), DAZL (D), VASA (V), NANOS2 (N2) and NANOS3 (N3), in triplicate (columns) in 50, 10, 0 or single cells (rows) for TRA-1-81+/cKIT+ sorted from H1 day 9 EBs. (e) Immunofluorescence of cKIT, BLIMP1 and NANOS3 with OCT4A, and of NANOS3 with 5mC on EBs differentiated for 9 days from H1 hESCs. Staining is performed on adjacent sections and asterisk and diamond indicate the same cell. (f) Representative immunofluorescence images of BLIMP1 with VASA in testes from 7–10.5 weeks (n=3), shown is a 10.5-week testis and ovaries from 6–8 weeks (n=3), shown is an 8-week ovary. Nuclei were counterstained with DAPI (blue). Scale bars represent 10 um. Abbreviations: wk= week. All data are mean ± SEM.
Fig. 7
Fig. 7
In vitro PGC differentiation from hESCs using five alternate differentiation techniques. (a,b) Comparison of (a) the percent of O/B double positive single cells, and (b) O/B/N3 triple positive within the TRA-1-81+/cKIT+ sorted fraction from five alternate differentiation techniques. (c) Heat map of GAPDH (G), OCT4 (O), BLIMP1 (B), DAZL (D), VASA (V), NANOS3 (N3) and NANOS2 (N2) for H1 in triplicate (columns) in 100, 50, 10, 0 or single TRA-1-81+/cKIT+ cells (rows) sorted from H1 and UCLA1 hESCs using five alternate differentiation strategies.
Fig. 8
Fig. 8
Summarized roadmap of human germ line development. Reprogramming 1, occurs prior to 6–7 developmental weeks and is characterized by global loss of 5mC from PGC DNA. Reprogramming 2 begins in the common PGC progenitor stage after acquisition of H3K27me3 (10.5 weeks in testes and 8.5 weeks in ovaries) and involves global loss of H3K27me3 and H2A.Z followed by imprint erasure in cKIT+ PGCs more than 1 month later. In vitro hESC differentiation using TRA-1-81+/cKIT+ sorting generates a rare cKIT+ PGC population that is O/B double positive or O/B/N3 triple positive and corresponds to newly specified PGCs, prior to reprogramming 1. Abbreviations: O/B = OCT4/BLIMP1, O/B/N3 = OCT4/BLIMP1/NANOS3, LOI= Loss Of Imprinting, MPI= Meiotic Prophase I.

Comment in

References

    1. Ohinata Y, et al. A signaling principle for the specification of the germ cell lineage in mice. Cell. 2009;137:571–84. - PubMed
    1. Hayashi K, et al. Offspring from Oocytes Derived from in Vitro Primordial Germ Cell-Like Cells in Mice. Science. 2012 Oct 4; [Epub ahead of print] - PubMed
    1. Reijo R, et al. Mouse autosomal homolog of DAZ, a candidate male sterility gene in humans, is expressed in male germ cells before and after puberty. Genomics. 1996;35:346–352. - PubMed
    1. Park TS, et al. Derivation of primordial germ cells from human embryonic and induced pluripotent stem cells is significantly improved by co-culture with human fetal gonadal cells. Stem Cells. 2009;27:783–795. - PMC - PubMed
    1. Gaskell TL, Esnal A, Robinson LLL, Anderson RA, Saunders PTK. Immunohistochemical profiling of germ cells within the human fetal testis: identification of three subpopulations. Biol Reprod. 2004;71:2012–2021. - PubMed

Publication types

MeSH terms