. 2013 Feb;14(2):152-61.
doi: 10.1038/ni.2496. Epub 2012 Dec 16.

The receptor PD-1 controls follicular regulatory T cells in the lymph nodes and blood

Affiliations

The receptor PD-1 controls follicular regulatory T cells in the lymph nodes and blood

Peter T Sage et al. Nat Immunol. 2013 Feb.

Abstract

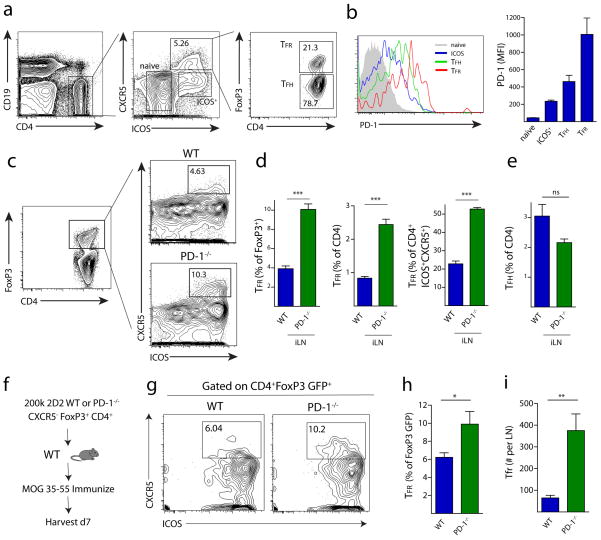
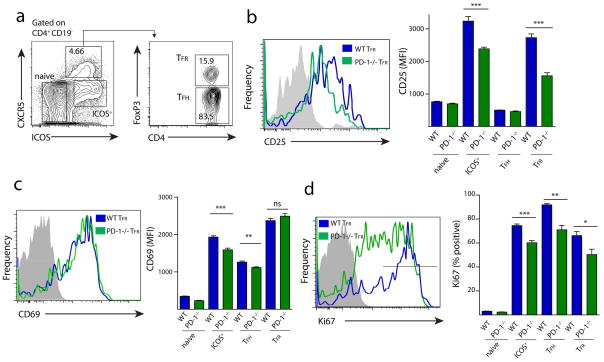
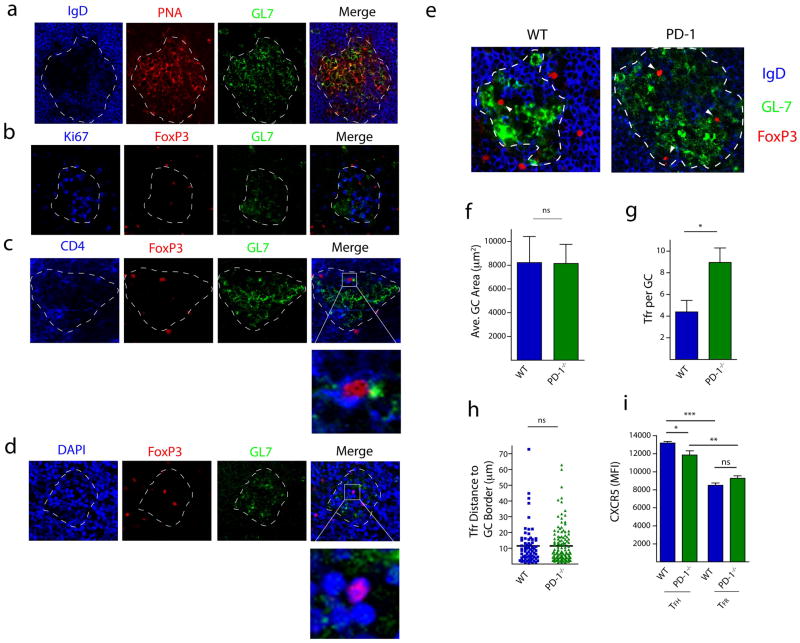
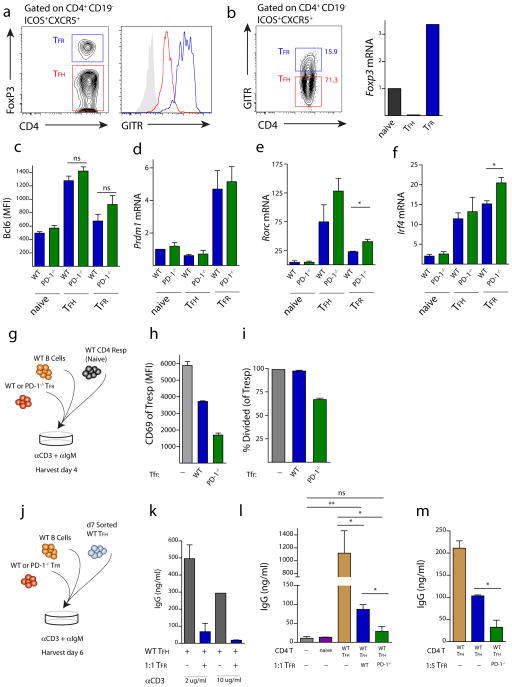
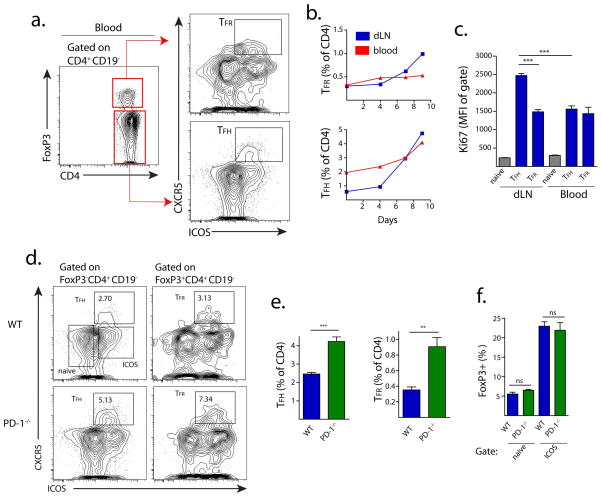
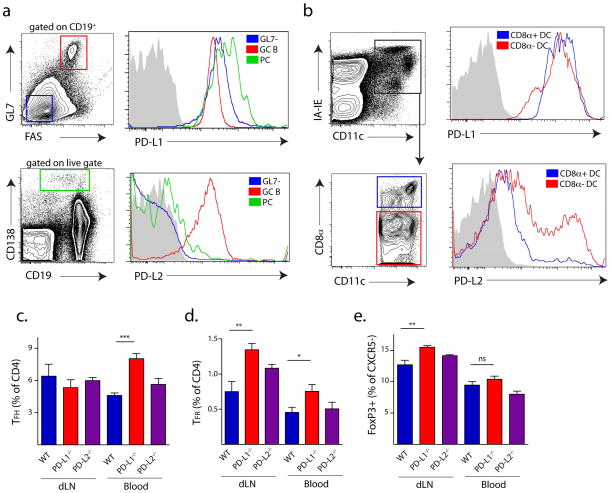
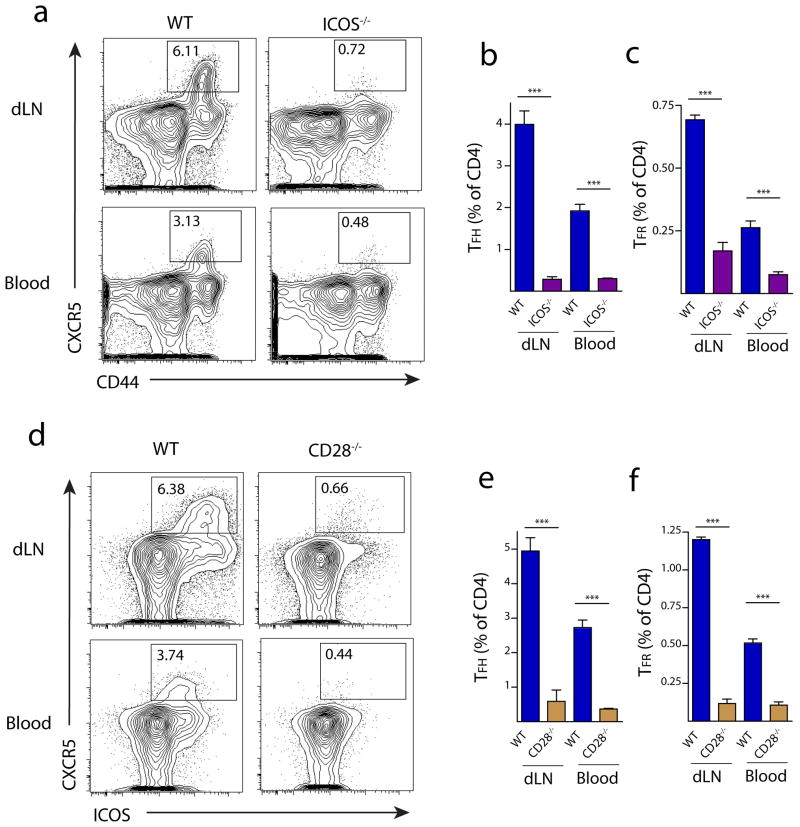
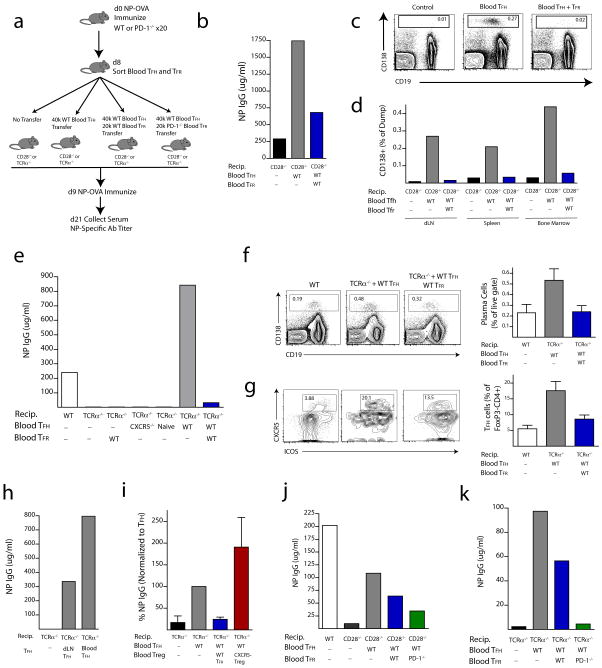
CD4(+)CXCR5(+)Foxp3(+) follicular regulatory T cells (T(FR) cells) inhibit humoral immunity mediated by CD4(+)CXCR5(+)Foxp3(-) follicular helper T cells (T(FH) cells). Although the inhibitory receptor PD-1 is expressed by both cell types, its role in the differentiation of T(FR) cells is unknown. Here we found that mice deficient in PD-1 and its ligand PD-L1 had a greater abundance of T(FR) cells in the lymph nodes and that those T(FR) cells had enhanced suppressive ability. We also found substantial populations of T(FR) cells in mouse blood and demonstrated that T(FR) cells in the blood homed to lymph nodes and potently inhibited T(FH) cells in vivo. T(FR) cells in the blood required signaling via the costimulatory receptors CD28 and ICOS but were inhibited by PD-1 and PD-L1. Our findings demonstrate mechanisms by which the PD-1 pathway regulates antibody production and help reconcile inconsistencies surrounding the role of this pathway in humoral immunity.


Figures

Figure 1
Figure 1
PD-1 signaling in FoxP3 Tregs limits the generation of T follicular regulatory cells. (a) Quantitation of TFR cells. WT mice were immunized with MOG/CFA and 7 days later draining lymph nodes were isolated and immediately stained for CD4+FoxP3+ICOS+CXCR5+CD19 T follicular regulatory cells (TFR), CD4+FoxP3ICOS+CXCR5+CD19 T follicular helper cells (TFH), CD4+ICOSCXCR5CD19 cells (naive) or CD4+ICOS+CXCR5CD19 cells (ICOS+). Numbers indicate percentages of cells located within each gate. (b) PD-1 expression by flow cytometry on WT naive, ICOS+, TFR and TFH cells. Populations were gated as in (a). (c) Gating of TFR cells from total FoxP3+ cells in WT and PD-1−/− mice immunized with MOG/CFA and analyzed 7 days later and stained as in (a). (d) Quantitation of WT or PD-1−/− TFR cells gated in (c) and expressed as a percentage of CD4+FoxP3+ (left), percentage of total CD4 T cells (middle), or percentage of CD4+ICOS+CXCR5+CD19 gate (right). (e) Quantitation of TFH cells as a percentage of total CD4 T cells. Data represent means of 5 mice per group. All error bars indicate standard error. (f) PD-1 on FoxP3+ cells has a cell-intrinsic role in inhibiting TFR differentiation in vivo. Schematic design of a transfer assay in which 2D2 TCR transgenic CD4+FoxP3+CXCR5 non-TFR Tregs were transferred into WT mice which were subsequently immunized with MOG/CFA. Draining lymph nodes were harvested 7 days later and analyzed for TFR cells. (g) Representative gating of TFR cells from transfer experiments described in (f). (h–i) Quantitation of TFR cells from transfer experiments expressed as a percentage of FoxP3 GFP+ cells present on day 7 post immunization (h) or total cell number (i) per lymph node. All data are representative of at least two independent experiments with at least 5 mice per group. All error bars indicate standard error. * P<0.05, ** P<0.005
Figure 2
Figure 2
PD-1 deficient TFR cells have altered expression of activation markers. (a) TFR cell gating strategy. WT or PD-1−/− mice were immunized with MOG/CFA and draining lymph nodes were harvested 7 days later. (b) CD25 expression on WT and PD-1−/− CD4 subsets gated as in (a). Overlay histograms of WT and PD-1−/− TFR cells (left) and mean fluorescence intensity (MFI) in CD4 subsets gated as in (a) (right). Data represent means of 5 mice per group. (c) CD69 expression on WT and PD-1−/− CD4 subsets gated as in (a). Overlay histograms of WT and PD-1−/− TFR cells (left) and MFI (right). Data represent means of 5 mice per group. (d) Intracellular staining of cell cycle marker Ki67 in populations as in (a). Overlay histograms of WT and PD-1−/− TFR cells (left) and percent Ki67 high (right) in CD4 subsets gated as in (a). Ki67 high was defined as the highest intensity peak on WT TFR cells and is denoted by a black bar on the histogram. Data represent means of 5 mice per group. All data are representative of at least two independent experiments. All error bars indicate standard error. * P<0.05, ** P<0.005, *** P<0.0005.
Figure 3
Figure 3
PD-1 deficient TFR cells are capable of homing to germinal centers (GCs). (a) Micrographs of draining lymph node sections from WT mice immunized with MOG/CFA and harvested 7 days later. Sections were cut and stained for GL-7 (green), PNA (red) and IgD (blue). GCs were identified by PNA and GL7 positive, but IgD negative, staining. GCs are indicated with a white dotted line. (b) Ki67 staining in GCs. Sections were stained for the cell cycle marker Ki67 (blue), FoxP3 (red) and GL7 (green). (c) Colocalization of CD4 and FoxP3. Sections were stained for CD4 (blue), FoxP3 (red) and GL7 (green). Box indicates magnification highlighting CD4 positive staining on FoxP3+ cells (d) Colocalization of FoxP3 in the nucleus. Sections were stained with the nuclear stain DAPI (blue), FoxP3 (red) and GL7 (green). Box indicates magnification highlighting FoxP3 protein within DAPI positive nuclei. (e) Comparison of FoxP3+ TFR cells in germinal centers of WT and PD-1−/− mice. Representative GC staining in WT and PD-1−/− lymph nodes 7 days after immunization with MOG/CFA. (f) Average GC area was determined by calculating the area within the dotted lines according to materials and methods. Data represent mean area per lymph node of 5 individual mice. (g) Numbers of FoxP3+ cells contained within GCs. Data represent mean per GC from 5 pooled mice. (h) Quantitation of the distance of each FoxP3+ cell to the GC border. The distance for each FoxP3+ cell in (e) from the GC borders (dotted line in (e)) was calculated as described in materials and methods. (i) CXCR5 expression was quantified on WT and PD-1−/− CD4+ICOS+CXCR5+FoxP3CD19 TFH and CD4+ICOS+CXCR5+FoxP3+CD19 TFR cells by flow cytometry 7 days after MOG/CFA immunization. Data represent means of 5 mice per group. * P<0.05, ** P<0.005, *** P<0.0005.
Figure 4
Figure 4
PD-1 deficient TFR cells have enhanced regulatory capacity. (a) TFR cells express high levels of GITR. WT mice were immunized with MOG/CFA and 7 days later lymph node cells were isolated and expression of GITR on TFR (CD4+FoxP3+ICOS+CXCR5+CD19, blue) and TFH (CD4+FoxP3ICOS+CXCR5+CD19, red) was quantified as shown by histogram overlays. (b) Expression of FoxP3 mRNA in sorted TFR (CD4+GITR+ICOS+CXCR5+CD19), TFH (CD4+GITRICOS+CXCR5+CD19) and naive (CD4+ICOSCXCR5CD19) cells. Data represent fold change in mRNA normalized to Hprt. (c) Bcl6 expression analyzed by intracellular flow cytometry on TFH and TFR cells from WT (blue) and PD-1−/− (green) mice. (d–f) mRNA expression of (d) blimp-1/Prdm1 (e) Rorc and (f) Irf4 from sorted WT (blue) and PD-1−/− (green) TFR and TFH cells and in CD4-ICOSCXCR5 (naive) cells quantified by qPCR analysis. Data represent means from at least three separate experiments in which cells were sorted from lymph nodes of 10 pooled mice. (g) Design of assay to analyze capacity of TFR cells to inhibit activation of naïve CD4 T cells. WT and PD-1−/− mice were immunized with MOG/CFA and TFR cells were sorted from draining lymph nodes and plated 1:1:1 with CFSE-labeled CD4 naïve WT (CD4+CD62L+FoxP3) responder cells and WT GL7B220+ B cells from MOG/CFA immunized mice along with anti-CD3 and anti-IgM for 4 days. 3 days later samples were analyzed by flow cytometry. (h) PD-1−/− TFR cells suppress activation of naïve T cells to a greater extent than WT TFR cells. T responders from suppression assays from (g) were analyzed for CD69 expression (h) and proliferation (i) by measuring CFSE dilution. % divided indicates percent of cells that have gone through at least one division. (j) In vitro IgG suppression assay design. TFR cells sorted as in (g) were plated in a 1:1:1 ratio of TFR (CD4+ICOS+CXCR5+GITR+CD19), TFH (CD4+ICOS+CXCR5+GITRCD19), and B (GL-7B220+) cells from draining lymph nodes of MOG/CFA immunized mice in the presence of anti-CD3 and anti-IgM for 6 days. Total IgG was measured by ELISA from supernatants. (k) Suppression assay using two concentrations of anti-CD3. (l) PD-1 deficient TFR cells suppress IgG production to a greater extent than WT TFR cells at a 1:1 TFR:TFH ratio. Naive (CD4+ICOSCXCR5CD19) cells from immunized mice were included as controls. (m) PD-1 deficient TFR cells suppress IgG production to a greater extent than WT TFR cells at a 1:5 TFR:TFH ratio. Data indicates means +/− standard error of replicate wells and is representative of at least two experiments (h–m). * P<0.05, ** P<0.005, *** P<0.0005.
Figure 5
Figure 5
PD-1 controls circulating blood TFR cells. (a) Gating strategy to identify circulating TFH and TFR cells from blood. WT mice were immunized with MOG/CFA and blood was collected 7 days later by cardiac puncture. TFH and TFR populations were gated as shown. (b) Quantitation of blood TFH and TFR cells following MOG/CFA immunization. Mice were immunized as in (a) and sacrificed on the indicated days. Blood was collected and cells stained and gated as in (a). (c) Ki67 expression in blood and lymph node TFH, TFR and naïve (CD4+ICOSCXCR5) cells 7 days after MOG/CFA immunization. (d–f) Comparison of blood TFH and TFR cells in WT and PD-1−/− mice immunized as in (a) and harvested 7 days after immunization. (d) Blood TFH cells are shown gated on FoxP3CD4+CD19 (left) and TFR cells are shown gated on FoxP3+CD4+CD19 (right). (e) Quantitation of blood TFH and TFR cells from immunized WT and PD-1−/− mice gated as in (d) and expressed as a percent of CD4+CD19 cells. (f) Quantitation of CXCR5 FoxP3+ cells from immunized WT and PD-1−/− mice, expressed as a percentage of CXCR5 CD4+ cells. All data indicates means +/− standard error of 5 mice and is representative of at least two independent experiments. * P<0.05, ** P<0.005, *** P<0.0005.
Figure 6
Figure 6
PD-L1 but not PD-L2 controls blood TFR cells. (a) PD-L1 and PD-L2 expression on B cell subsets. WT mice were immunized with NP-OVA subcutaneously and 12 days later germinal center B (GC B), GL7, and plasma cells (PC) from draining lymph nodes were analyzed for PD-L1 (top) and PD-L2 (bottom) expression. (b) PD-L1 and PD-L2 expression on dendritic cells (DC). WT mice were immunized with NP-OVA and 3 days later CD8α+ DC and CD8α DC subsets from draining lymph nodes were analyzed for PD-L1 (top) and PD-L2 (bottom) expression. (c) Lymph node and blood TFH and TFR cells in PD-1 ligand deficient mice. WT, PD-L1−/− and PD-L2−/− mice were immunized with MOG/CFA, and 7 days later draining lymph nodes and blood were harvested and analyzed for TFH (c), TFR (d) and CXCR5 FoxP3+ (e) CD4 T cells. Data represent means of 5 mice per group. All data are representative of at least two independent experiments. * P<0.05, ** P<0.005, *** P<0.0005.
Figure 7
Figure 7
Blood TFR cells require ICOS and CD28 costimulation. (a) TFH and TFR gating in WT and ICOS−/− mice. Mice were immunized with MOG/CFA and 7 days later draining lymph nodes (dLN) and blood were harvested. TFH cells were gated as CD4+CD44+CXCR5+FoxP3CD19, and TFR cells as CD4+CD44+CXCR5+FoxP3+CD19 cells. TFH (b) and TFR (c) quantitation in lymph nodes (dLN) and blood of WT and ICOS−/− mice as in (a). (d) TFH and TFR gating strategy in WT and CD28−/− mice. Mice were immunized as in (a) and TFH cells were gated as CD4+ICOS+CXCR5+FoxP3CD19 and TFR cells as CD4+ICOS+CXCR5+FoxP3+CD19. TFH (e) and TFR (f) quantitation in lymph nodes and blood of WT and CD28−/− mice gated as in (d). All data are representative of at least two independent experiments. * P<0.05, ** P<0.005, *** P<0.0005.
Figure 8
Figure 8
PD-1 deficient blood TFR cells more potently regulate antibody production in vivo. (a) Experimental strategy to assess blood TFH and TFR cell function by transfer of blood TFH and/or TFR cells into mice that lack both lymph node and blood TFH/TFR cells. Blood TFH and/or TFR cells were isolated from 20 pooled mice immunized with NP-OVA 8 days previously and CD4+CXCR5+GITRCD19 TFH and CD4+CXCR5+GITR+CD19 TFR cells were purified by cell sorting; recipient CD28−/− or TCRα−/− mice received either no cells, 4×10⁴ TFH cells, or 4×10⁴ TFH plus 2×10⁴ TFR cells. One day later recipients were immunized with NP-OVA. 12 days later sera were collected and NP-specific antibody titers quantified by ELISA. (b) WT blood TFR cells potently suppress antibody production. NP-specific antibody titers from experiments as in (a) in which WT TFH or WT TFH plus WT TFR cells were transferred into CD28−/− recipients. (c) CD138+ plasma cell percentages in draining lymph nodes of CD28−/− recipients following no transfer (Control), Blood TFH transfer (Blood TFH) or Blood TFH plus TFR cell transfer (Blood TFH + TFR) 24 days after immunization. Cells are gated as a percentage of CD11bCD11cLy6c (dump) cells. (d) Quantitation of CD138 plasma cells as gated in (c) in draining lymph node, spleen and bone marrow. (e) Blood TFH and/or TFR Transfer into TCRα−/− recipients using experimental design as in (a). Comparison of NP-specific antibody titers in (1) WT control mice, (2) TCRα−/− recipients −/− recipients given WT blood T −/− given no cells, (3) TCRα FR cells alone, (4) TCRα recipients given total blood CD4 T cells from CXCR5−/− mice immunized with NP-OVA 8 days previously, (5) TCRα−/− recipients given blood CD4+FoxP3 cells from unimmunized FoxP3-GFP mice, (6) TCRα−/− recipients given WT blood TFH cells, and (7) TCRα−/− recipients given WT blood TFH cells plus TFR cells. NP specific IgG levels were determined by ELISA. (f) CD138+ plasma cells from the spleen (gated as a percent of live cells) and (g) CD4+FoxP3 TFH cells from the draining lymph node pre-gated on CD4+FoxP3 were quantified from experiments in (e) 12 days after secondary immunization. Error bars indicate standard error of at least three separate experiments. (h) Blood TFH cells can have an enhanced ability to stimulate antigen-specific antibody production compared to lymph node TFH cells. Blood TFH cells and draining lymph node TFH cells were isolated from WT mice immunized with NP-OVA 8 days previously and 4×10⁶ cells were transferred into TCRα−/− mice and immunized as in (e). (i) Blood TFR cell suppression is aided by the follicular program. Blood TFH cells were transferred to TCRα−/− mice along with blood CXCR5− FoxP3 GFP+ cells from FoxP3 reporter mice or blood TFR cells. Antibody titers were quantified 12 days after NP-OVA immunization and NP IgG levels are expressed as a percent of TFH transfer group. Data indicate standard error of at least three independent experiments. (j–k) PD-1 deficient blood TFR cells more potently suppress antibody production in vivo compared to WT TFR cells. 4×10⁴ WT blood TFH and 1.5×10⁴ WT or PD-1 deficient blood TFR cells from mice immunized with NP-OVA 8 days previously were transferred into CD28−/− mice (j) or TCRα−/− mice (k). Recipient mice were immunized with NP-OVA, and NP specific antibody titers were measured from serum 12 days later. Data are representative of two independent experiments.

Comment in

References

    1. Crotty S. Follicular helper CD4 T cells (TFH) Annu Rev Immunol. 2011;29:621–663. - PubMed
    1. Johnston RJ, et al. Bcl6 and Blimp-1 are reciprocal and antagonistic regulators of T follicular helper cell differentiation. Science. 2009;325:1006–1010. - PMC - PubMed
    1. Nurieva RI, et al. Bcl6 mediates the development of T follicular helper cells. Science. 2009;325:1001–1005. - PMC - PubMed
    1. Choi YS, et al. ICOS receptor instructs T follicular helper cell versus effector cell differentiation via induction of the transcriptional repressor Bcl6. Immunity. 2011;34:932–946. - PMC - PubMed
    1. Nurieva RI, et al. Generation of T follicular helper cells is mediated by interleukin-21 but independent of T helper 1, 2, or 17 cell lineages. Immunity. 2008;29:138–149. - PMC - PubMed

Publication types

MeSH terms