

Understanding increments in model performance metrics
- PMID: 23242535
- PMCID: PMC3656609
- DOI: 10.1007/s10985-012-9238-0
Understanding increments in model performance metrics
Abstract
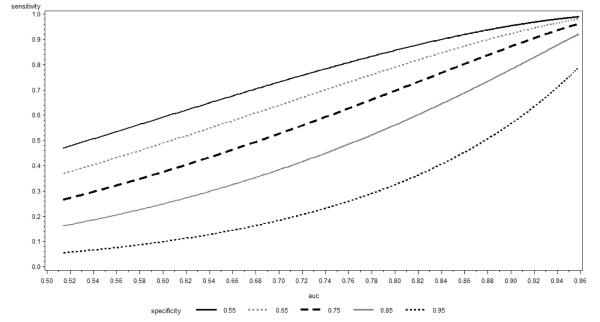
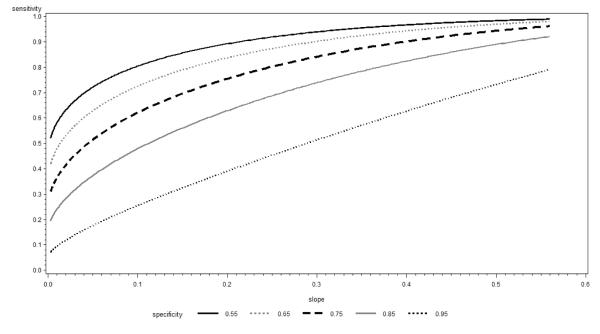
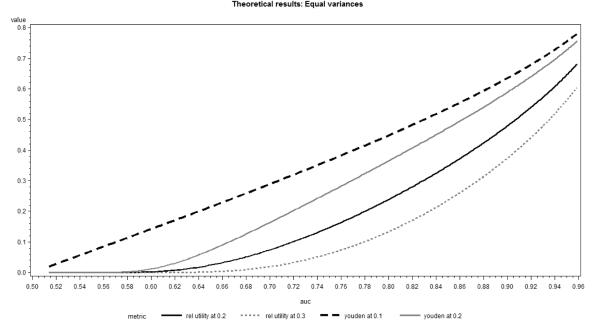
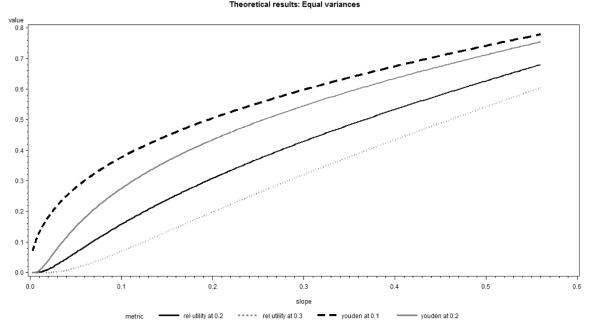
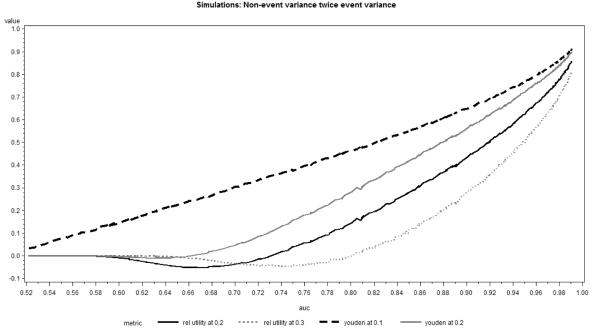
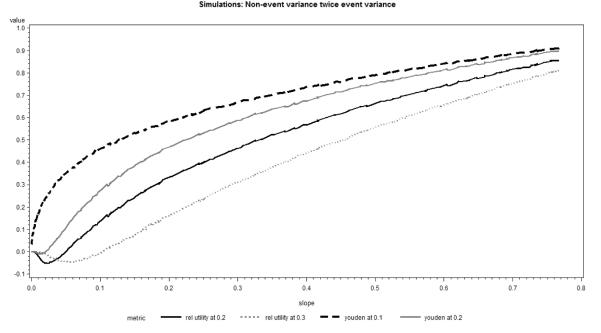
The area under the receiver operating characteristic curve (AUC) is the most commonly reported measure of discrimination for prediction models with binary outcomes. However, recently it has been criticized for its inability to increase when important risk factors are added to a baseline model with good discrimination. This has led to the claim that the reliance on the AUC as a measure of discrimination may miss important improvements in clinical performance of risk prediction rules derived from a baseline model. In this paper we investigate this claim by relating the AUC to measures of clinical performance based on sensitivity and specificity under the assumption of multivariate normality. The behavior of the AUC is contrasted with that of discrimination slope. We show that unless rules with very good specificity are desired, the change in the AUC does an adequate job as a predictor of the change in measures of clinical performance. However, stronger or more numerous predictors are needed to achieve the same increment in the AUC for baseline models with good versus poor discrimination. When excellent specificity is desired, our results suggest that the discrimination slope might be a better measure of model improvement than AUC. The theoretical results are illustrated using a Framingham Heart Study example of a model for predicting the 10-year incidence of atrial fibrillation.
Figures
References
-
- Cook NR. Use and misuse of the receiver operating characteristics curve in risk prediction. Circulation. 2007;115(7):928–935. - PubMed
-
- Cox DR. Regression Models and Life Tables. J. R. Statist. Soc. Series B. 1972;34:187–220.
-
- DeLong ER, DeLong DM, Clarke-Pearson DL. Comparing areas under two or more correlated reciever operating characteristics curves: a nonparamentric approach. Biometrics. 1988;44(3):837–845. - PubMed
Publication types
MeSH terms
Grants and funding
LinkOut - more resources
Full Text Sources
Other Literature Sources
