

Darbepoietin-alfa has comparable erythropoietic stimulatory effects to recombinant erythropoietin whilst preserving the bone marrow microenvironment
- PMID: 23242598
- PMCID: PMC3640110
- DOI: 10.3324/haematol.2012.078709
Darbepoietin-alfa has comparable erythropoietic stimulatory effects to recombinant erythropoietin whilst preserving the bone marrow microenvironment
Abstract
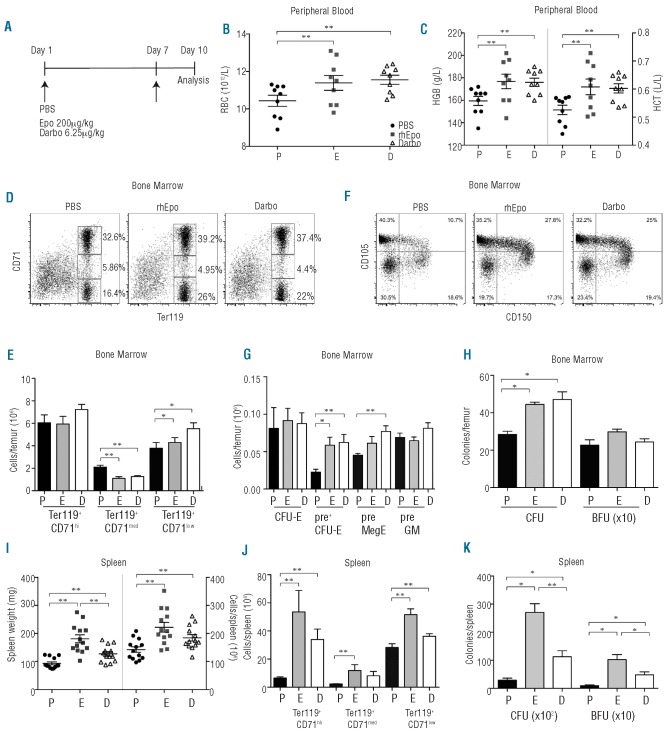
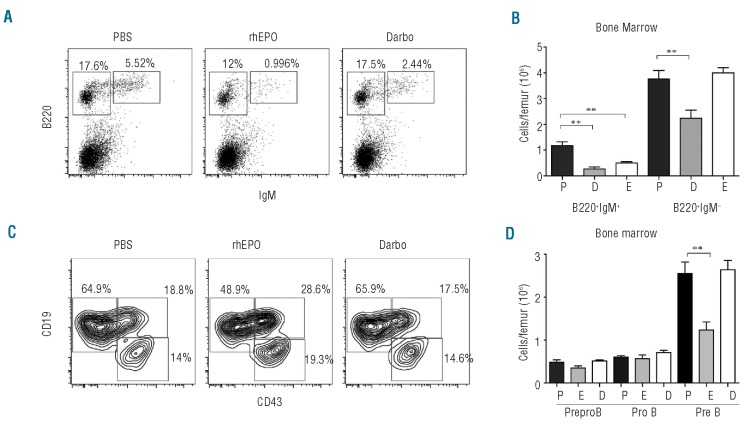
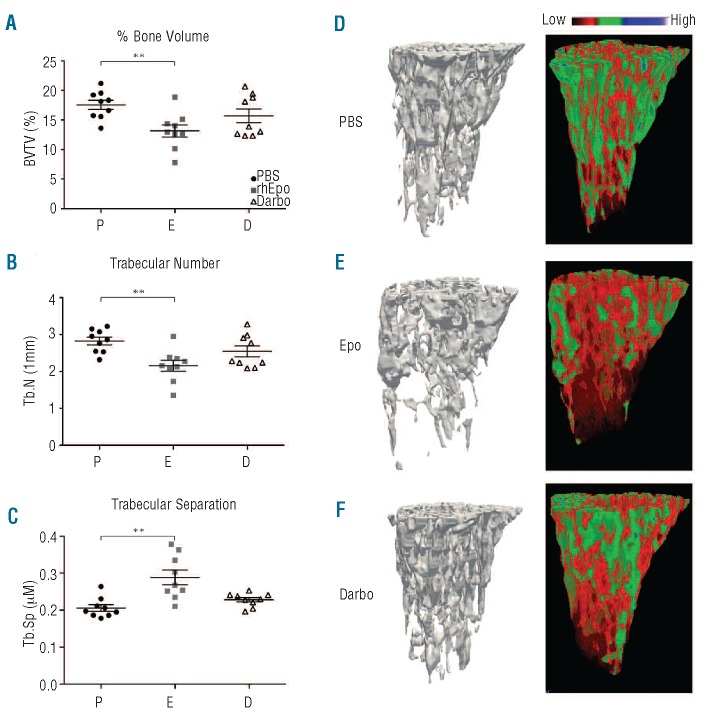
Erythropoiesis stimulating agents are widely used for the treatment of anemia. Recently, we reported erythroid expansion with impaired B lymphopoiesis and loss of trabecular bone in C57BL/6 mice following ten days of treatment with low-dose short acting recombinant human erythropoietin. We have assessed erythropoietin against longer-acting darbepoietin-alfa at a comparable erythroid stimulatory dosage regime. Darbepoietin-alfa and erythropoietin induced similar in vivo erythropoietic expansion. Both agents induced an expansion of the colony-forming unit-erythroid populations. However, unlike erythropoietin, darbepoietin-alfa did not impair bone marrow B lymphopoiesis. Strikingly the bone loss observed with erythropoietin was not apparent following darbepoietin-alfa treatment. This analysis demonstrates that whilst darbepoietin-alfa has similar in vivo erythropoietic potency to erythropoietin, it preserves the bone marrow microenvironment. Thus erythropoietin and darbepoietin-alfa manifest different action showing that erythropoiesis stimulating agents have differential non-erythroid effects dependent on their duration of action.
Figures
Similar articles
-
Erythropoietin couples erythropoiesis, B-lymphopoiesis, and bone homeostasis within the bone marrow microenvironment.Blood. 2011 May 26;117(21):5631-42. doi: 10.1182/blood-2010-11-320564. Epub 2011 Mar 18. Blood. 2011. PMID: 21421837
-
CNTO 530 functions as a potent EPO mimetic via unique sustained effects on bone marrow proerythroblast pools.Blood. 2009 May 14;113(20):4955-62. doi: 10.1182/blood-2008-08-172320. Epub 2009 Mar 5. Blood. 2009. PMID: 19264917 Free PMC article.
-
[Effectiveness of darbepoietin alfa in anemic patients with chronic kidney disease (CKD) in predialysis period].Pol Arch Med Wewn. 2006 Jul;116(1):663-70. Pol Arch Med Wewn. 2006. PMID: 17340973 Polish.
-
Optimizing the use of erythropoietic agents-- pharmacokinetic and pharmacodynamic considerations.Nephrol Dial Transplant. 2002;17 Suppl 5:66-70. doi: 10.1093/ndt/17.suppl_5.66. Nephrol Dial Transplant. 2002. PMID: 12091611 Review.
-
Darbepoetin alfa: a novel erythropoiesis-stimulating protein.Drugs Today (Barc). 2003 Jul;39(7):477-95. doi: 10.1358/dot.2003.39.7.799441. Drugs Today (Barc). 2003. PMID: 12973399 Review.
Cited by
-
Erythropoietin inhibits osteoblast function in myelodysplastic syndromes via the canonical Wnt pathway.Haematologica. 2018 Jan;103(1):61-68. doi: 10.3324/haematol.2017.172726. Epub 2017 Oct 27. Haematologica. 2018. PMID: 29079596 Free PMC article.
-
Separate and combined effects of hypobaric hypoxia and hindlimb suspension on skeletal homeostasis and hematopoiesis in mice.Hypoxia (Auckl). 2019 Jul 25;7:41-52. doi: 10.2147/HP.S195827. eCollection 2019. Hypoxia (Auckl). 2019. PMID: 31440522 Free PMC article.
-
Renal Proximal Tubule Cell Cannabinoid-1 Receptor Regulates Bone Remodeling and Mass via a Kidney-to-Bone Axis.Cells. 2021 Feb 17;10(2):414. doi: 10.3390/cells10020414. Cells. 2021. PMID: 33671138 Free PMC article.
References
-
- Chateauvieux S, Grigorakaki C, Morceau F, Dicato M, Diederich M. Erythropoietin, erythropoiesis and beyond. Biochem Pharmacol. 2011;82(10):1291–303 - PubMed
-
- Goodnough LT. The use of erythropoietin to increase red cell mass. Can J Anaesth. 2003;50(6 Suppl):S10–8 - PubMed
-
- Macdougall IC. New anemia therapies: translating novel strategies from bench to bedside. Am J Kidney Dis. 2012;59(3):444–51 - PubMed
-
- Nissenson AR. Novel erythropoiesis stimulating protein for managing the anemia of chronic kidney disease. Am J Kidney Dis. 2001;38(6):1390–7 - PubMed
Publication types
MeSH terms
Substances
LinkOut - more resources
Full Text Sources
