

Differential effects of rapamycin and retinoic acid on expansion, stability and suppressive qualities of human CD4(+)CD25(+)FOXP3(+) T regulatory cell subpopulations
- PMID: 23242600
- PMCID: PMC3729911
- DOI: 10.3324/haematol.2012.074088
Differential effects of rapamycin and retinoic acid on expansion, stability and suppressive qualities of human CD4(+)CD25(+)FOXP3(+) T regulatory cell subpopulations
Abstract
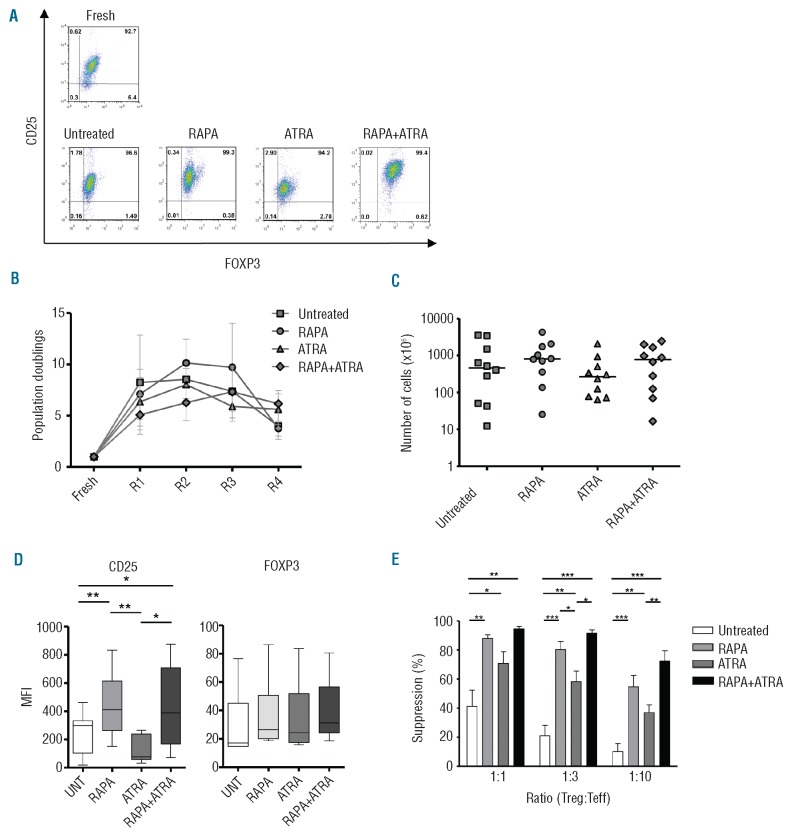
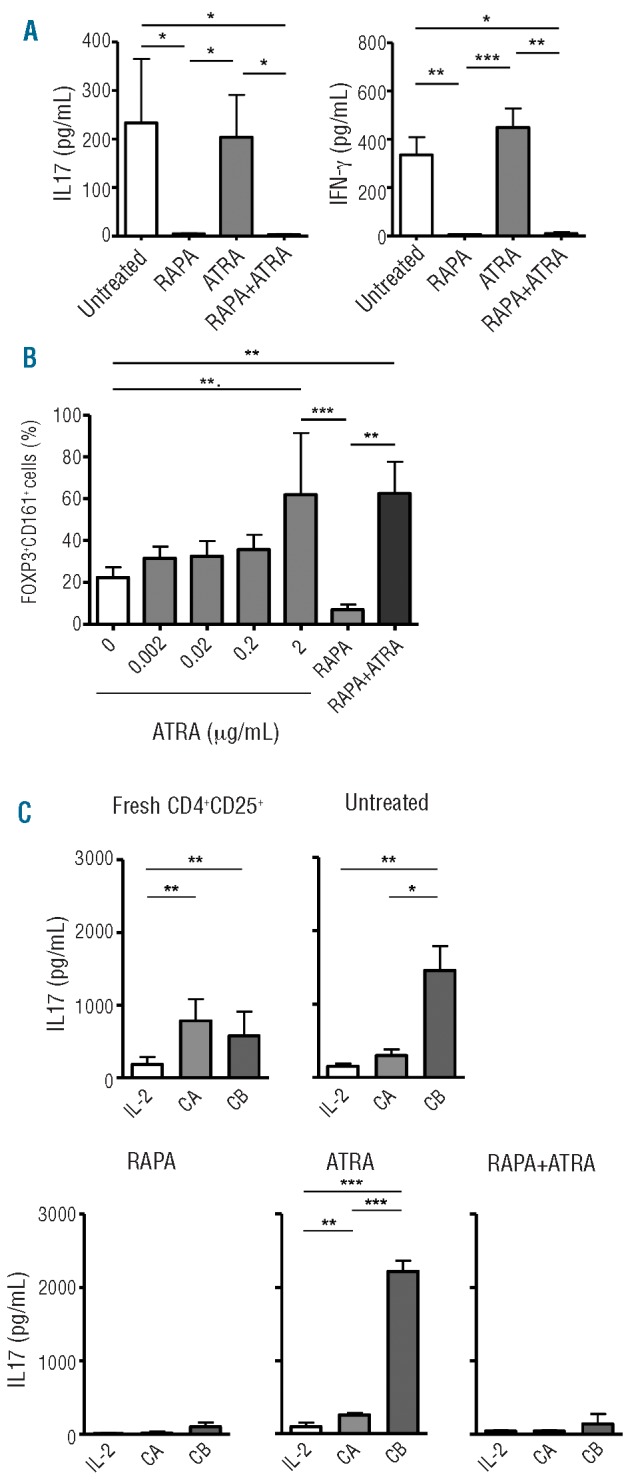
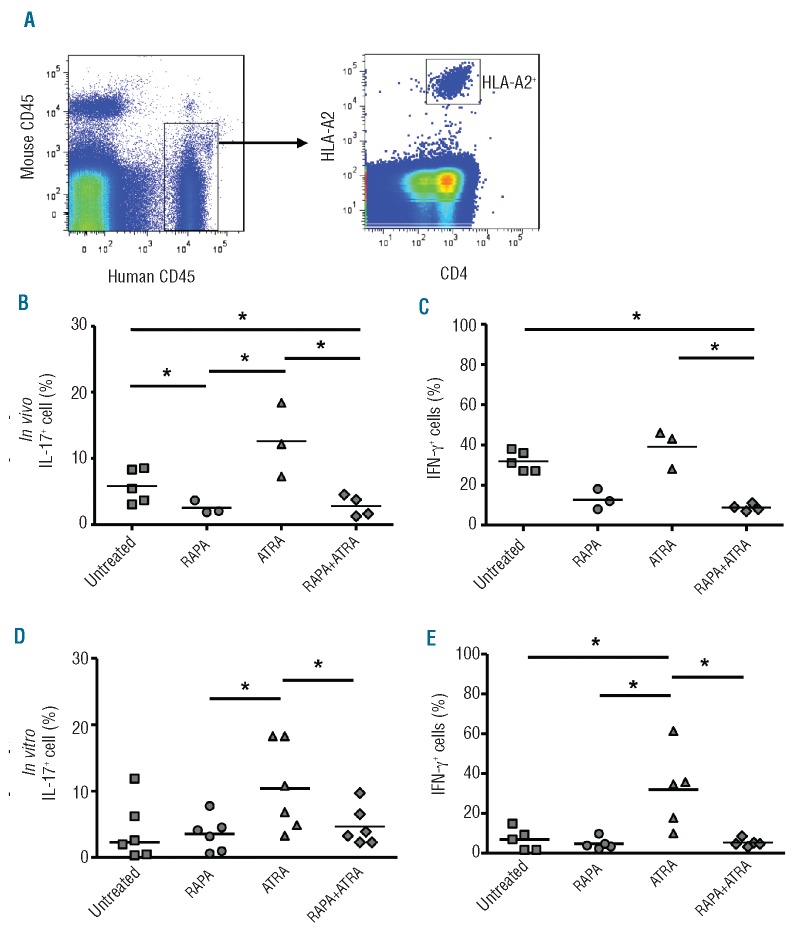
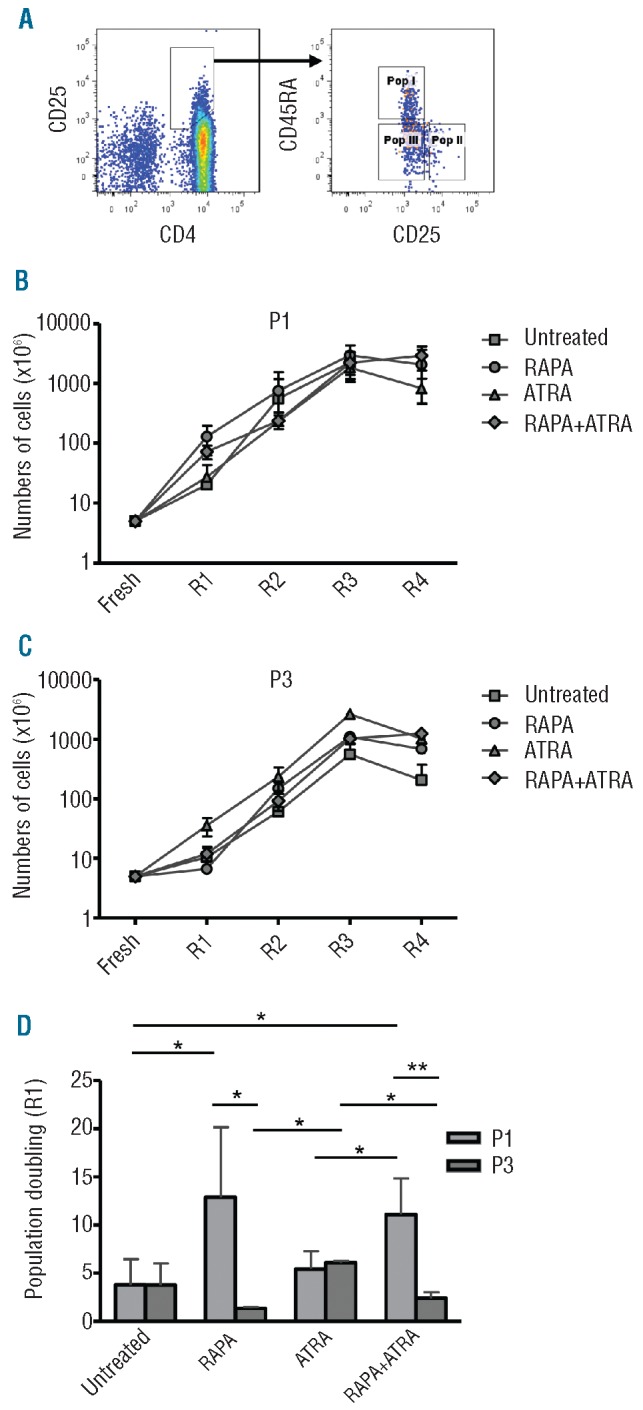
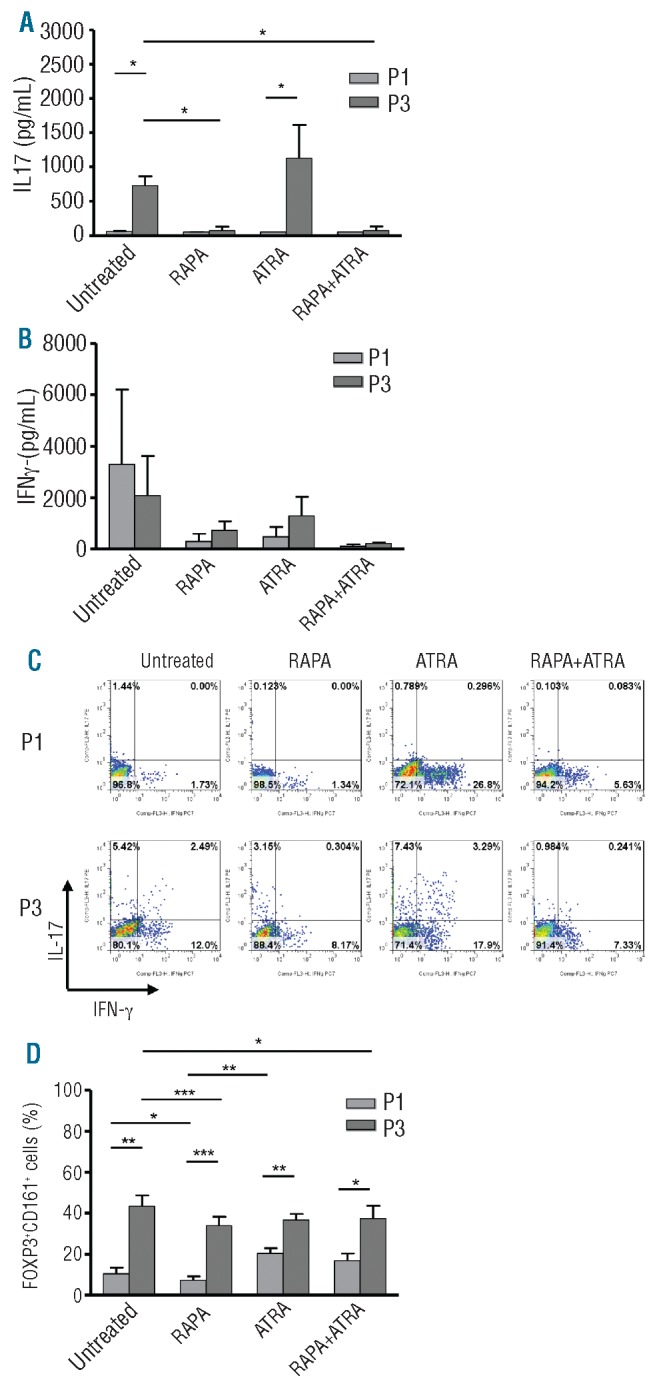
Adoptive transfer of ex vivo expanded CD4(+)CD25(+)FOXP3(+) regulatory T cells is a successful therapy for autoimmune diseases and transplant rejection in experimental models. In man, equivalent manipulations in bone marrow transplant recipients appear safe, but questions regarding the stability of the transferred regulatory T cells during inflammation remain unresolved. In this study, protocols for the expansion of clinically useful numbers of functionally suppressive and stable human regulatory T cells were investigated. Regulatory T cells were expanded in vitro with rapamycin and/or all-trans retinoic acid and then characterized under inflammatory conditions in vitro and in vivo in a humanized mouse model of graft-versus-host disease. Addition of rapamycin to regulatory T-cell cultures confirms the generation of high numbers of suppressive regulatory T cells. Their stability was demonstrated in vitro and substantiated in vivo. In contrast, all-trans retinoic acid treatment generates regulatory T cells that retain the capacity to secrete IL-17. However, combined use of rapamycin and all-trans retinoic acid abolishes IL-17 production and confers a specific chemokine receptor homing profile upon regulatory T cells. The use of purified regulatory T-cell subpopulations provided direct evidence that rapamycin can confer an early selective advantage to CD45RA(+) regulatory T cells, while all-trans retinoic acid favors CD45RA(-) regulatory T-cell subset. Expansion of regulatory T cells using rapamycin and all-trans retinoic acid drug combinations provides a new and refined approach for large-scale generation of functionally potent and phenotypically stable human regulatory T cells, rendering them safe for clinical use in settings associated with inflammation.
Figures
Similar articles
-
Rapamycin promotes the enrichment of CD4(+)CD25(hi)FoxP3(+) T regulatory cells from naïve CD4(+) T cells of baboon that suppress antiporcine xenogenic response in vitro.Transplant Proc. 2009 Jan-Feb;41(1):418-21. doi: 10.1016/j.transproceed.2008.10.079. Transplant Proc. 2009. PMID: 19249569 Free PMC article.
-
Single and combined effect of retinoic acid and rapamycin modulate the generation, activity and homing potential of induced human regulatory T cells.PLoS One. 2017 Jul 26;12(7):e0182009. doi: 10.1371/journal.pone.0182009. eCollection 2017. PLoS One. 2017. PMID: 28746369 Free PMC article.
-
Characterization of protective human CD4CD25 FOXP3 regulatory T cells generated with IL-2, TGF-β and retinoic acid.PLoS One. 2010 Dec 17;5(12):e15150. doi: 10.1371/journal.pone.0015150. PLoS One. 2010. PMID: 21179414 Free PMC article.
-
Retinoic acid generates regulatory T cells in experimental transplantation.Transplant Proc. 2011 Jul-Aug;43(6):2334-7. doi: 10.1016/j.transproceed.2011.06.057. Transplant Proc. 2011. PMID: 21839265 Review.
-
CD4(+)CD25 (+) regulatory T cells in human lupus erythematosus.Arch Dermatol Res. 2009 Jan;301(1):71-81. doi: 10.1007/s00403-008-0891-9. Epub 2008 Nov 5. Arch Dermatol Res. 2009. PMID: 18985367 Review.
Cited by
-
The Impact of Cellular Therapies on Gastrointestinal Diseases: Applications and Challenges.Turk J Gastroenterol. 2023 Aug;34(8):782-794. doi: 10.5152/tjg.2023.23137. Turk J Gastroenterol. 2023. PMID: 37485563 Free PMC article. Review.
-
Ex Vivo Expanded Human Non-Cytotoxic CD8+CD45RClow/- Tregs Efficiently Delay Skin Graft Rejection and GVHD in Humanized Mice.Front Immunol. 2018 Jan 31;8:2014. doi: 10.3389/fimmu.2017.02014. eCollection 2017. Front Immunol. 2018. PMID: 29445370 Free PMC article.
-
Antigen presentation, autoantibody production, and therapeutic targets in autoimmune liver disease.Cell Mol Immunol. 2021 Jan;18(1):92-111. doi: 10.1038/s41423-020-00568-6. Epub 2020 Oct 27. Cell Mol Immunol. 2021. PMID: 33110250 Free PMC article. Review.
-
Differentiated all-trans retinoic acid response of naive CD4+CD25- cells isolated from rats with collagen-induced arthritis and healthy ones under in vitro conditions.Cent Eur J Immunol. 2017;42(1):39-53. doi: 10.5114/ceji.2017.67317. Epub 2017 May 8. Cent Eur J Immunol. 2017. PMID: 28680330 Free PMC article.
-
Regulatory T cell-derived exosomes: possible therapeutic and diagnostic tools in transplantation.Front Immunol. 2014 Nov 5;5:555. doi: 10.3389/fimmu.2014.00555. eCollection 2014. Front Immunol. 2014. PMID: 25414702 Free PMC article. Review.
References
-
- Miyara M, Gorochov G, Ehrenstein M, Musset L, Sakaguchi S, Amoura Z. Human FoxP3(+) regulatory T cells in systemic autoimmune diseases. Autoimmun Rev. 2011;10(12):744–55 - PubMed
-
- Di Ianni M, Falzetti F, Carotti A, Terenzi A, Castellino F, Bonifacio E, et al. Tregs prevent GVHD and promote immune reconstitution in HLA-haploidentical transplantation. Blood. 2011;117(14):3921–8 - PubMed
-
- Trzonkowski P, Bieniaszewska M, Juscinska J, Dobyszuk A, Krzystyniak A, Marek N, et al. First-in-man clinical results of the treatment of patients with graft versus host disease with human ex vivo expanded CD4+CD25+CD127− T regulatory cells. Clin Immunol. 2009;133(1):22–6 - PubMed
Publication types
MeSH terms
Substances
Grants and funding
LinkOut - more resources
Full Text Sources
Other Literature Sources
Research Materials
