. 2013 Jan;111(2):153-61.
doi: 10.1007/s11060-012-1008-z. Epub 2012 Dec 16.

Real-time multi-modality imaging of glioblastoma tumor resection and recurrence

Affiliations

Real-time multi-modality imaging of glioblastoma tumor resection and recurrence

Shawn Hingtgen et al. J Neurooncol. 2013 Jan.

Abstract

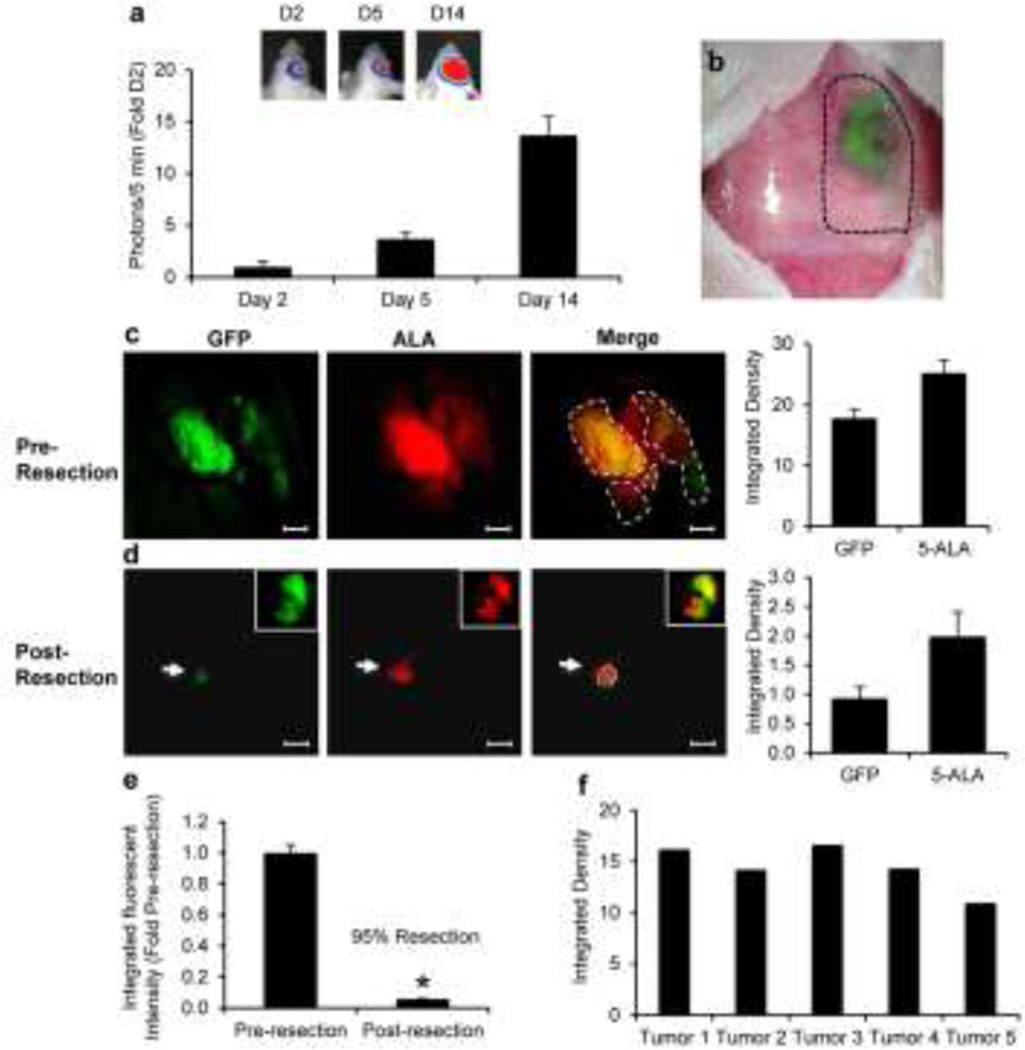
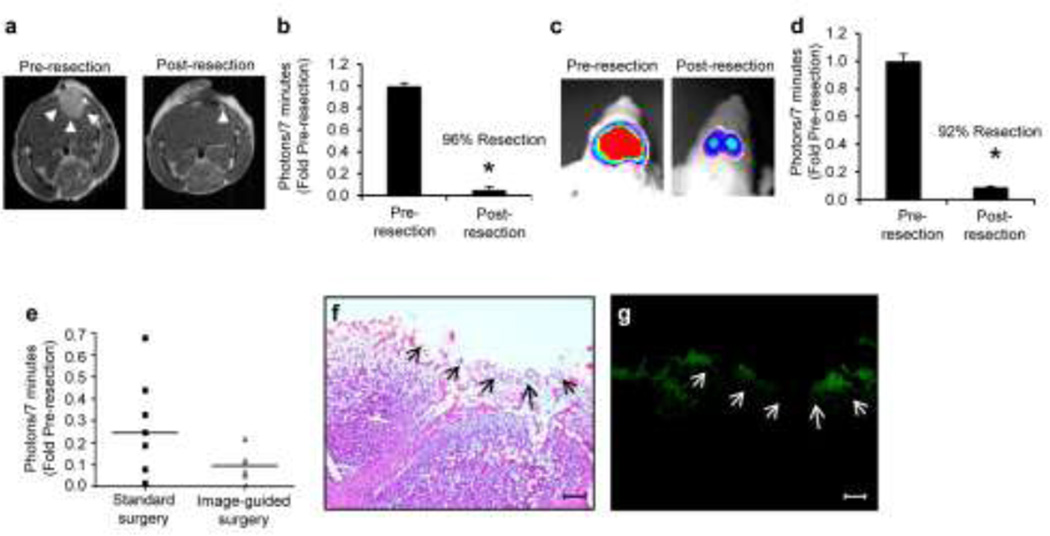
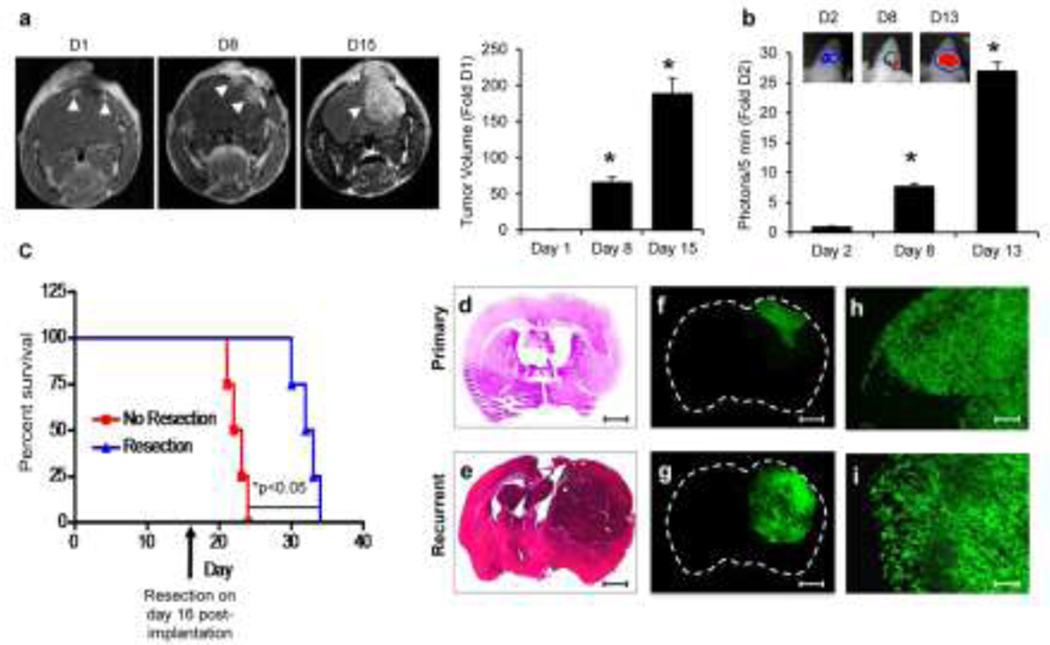
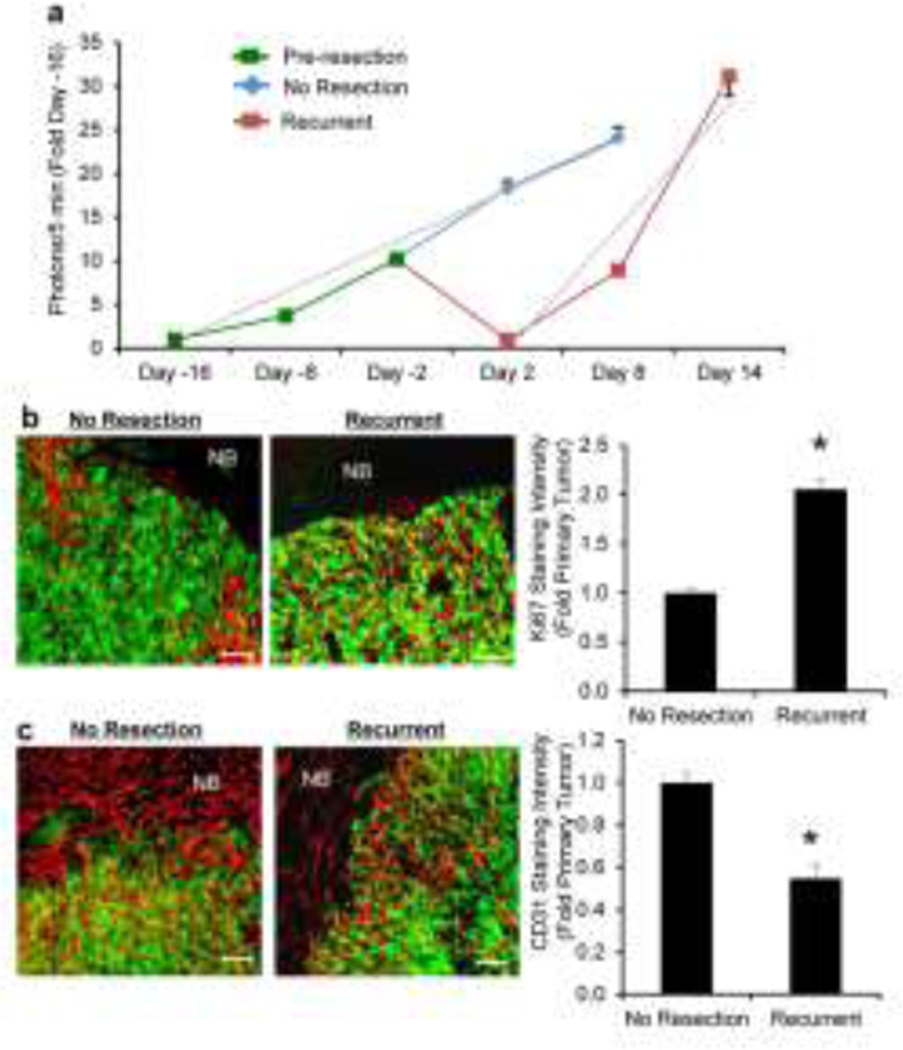
The lack of relevant pre-clinical animal models incorporating the clinical scenario of Glioblastoma multiforme (GBM) resection and recurrence has contributed significantly to the inability to successfully treat GBM. A multi-modality imaging approach that allows real-time assessment of tumor resection during surgery and non-invasive detection of post-operative tumor volumes is urgently needed. In this study, we report the development and implementation of an optical imaging and magnetic resonance imaging (MRI) approach to guide GBM resection during surgery and track tumor recurrence at multiple resolutions in mice. Intra-operative fluorescence-guided surgery allowed real-time monitoring of intracranial tumor removal and led to greater than 90 % removal of established intracranial human GBM. The fluorescent signal clearly delineated tumor margins, residual tumor, and correlated closely with the clinically utilized fluorescence surgical marker 5-aminolevulinic acid/porphyrin. Post-operative non-invasive optical imaging and MRI confirmed near-complete tumor removal, which was further validated by immunohistochemistry (IHC). Longitudinal non-invasive imaging and IHC showed rapid recurrence of multi-focal tumors that exhibited a faster growth rate and altered blood-vessel density compared to non-resected tumors. Surgical tumor resection significantly extended long-term survival, however mice ultimately succumbed to the recurrent GBM. This multi-modality imaging approach to GBM resection and recurrence in mice should provide an important platform for investigating multiple aspects of GBM and ultimately evaluating novel therapeutics.


Conflict of interest statement

Conflict of Interests: The authors have no conflicts to disclose.

Figures

Figure 1
Figure 1. Fluorescence-guided GBM resection and validation by 5-ALA
(a) Representative images and summary data showing the progression of orthotopic U87 human GBM in mice by BLI. (b) Representative image revealing the location of the U87-GFP-FLuc tumor visualized through the cranium. The borders of the cranial window were determined based on the fluorescent signature of the established tumor (depicted by dashed line). The craniotomy was then created to expose the underlying tumor. (c-d) Representative intra-operative fluorescent images of GFP-Fluc-expressing intracranial human GBM and validation by 5-ALA pre- (c) and post- (d) tumor resection. Insets depict GFP fluorescence, 5-ALA, or merged signal from excised tissue. Summary graphs demonstrating relative intracranial pre- and post- resection tumor volumes determined by GFP or 5-ALA imaging are shown. Dashed line shows area of co-localization between GFP and 5-ALA. (e) Summary graph demonstrating the extent of surgical resection determined by GFP fluorescence imaging. (f) Summary data showing the relative size of tumor tissue removed during surgical resection determined by GFP fluorescence imaging. Data are mean±SD, *P<0.05 determined by Students T test. Scale bars, 200 µm.
Figure 2
Figure 2. Quantitative non-invasive imaging of GBM volumes pre- and post-resection
Representative images and summary data of quantitative imaging showing the extent of surgical resection by MRI (a-b) and BLI (c-d). MRI: one day before resection and one day post-resection, mice underwent MRI imaging following intravenous injection of Gd-DTPA. Tumor volumes were determined using Image J analysis software. Arrows indicate tumor deposits. BLI: one day before resection and one day post-resection, tumor volumes were assessed by injecting mice with D-luciferin and photon emission was determine over 7 minutes. (e) Scatter plot showing residual tumor volumes determined by BLI following image-guided resection or standard non-guided surgery. Horizontal bar shows mean of each surgery type. (f-g) Representative white light H&E images (f) and fluorescent photomicrographs (g) of corresponding brain sections post-resection (day 1). Arrows in f and g indicate extent of resection of the tumor. Data are mean±SD, *P<0.05 determined by Students T test. Scale bars, 100 µm (f,g).
Figure 3
Figure 3. Multi-modality tracking of post-operative GBM recurrence
(a-b) Representative images and summary graphs showing the recurrence of GBMs following surgical resection by noninvasive imaging. Following surgical debulking, mice were subjected to MRI on days 1, 8, and 15 post-resection (a) or BLI on day 2, 8, and 13 post-resection (b). Arrows indicate tumor deposits in panel (a). (c) Kaplan-meier curves depicting the survival of control without surgical resection or mice that underwent tumor debulking. (d-i) Representative white light H&E images (d,e) and fluorescent photomicrographs (f-i) of brain sections from primary tumor bearing mice (d,f,h) and from mice with recurrent tumors 2 weeks post-resection (e,g,i). Following intracranial xenograft, mice were sacrificed 2 weeks post-implantation, or underwent surgical debulking and sacrificed 2 week post-surgery to visualize tumor recurrence. 2× magnification-d,e,f,g; 10× magnification-h,i. Data are mean±SD, *P<0.05 determined by ANOVA (panel a,b), and log rank test (panel c). Scale bars, 100 µm (d,e,f,g) and 400 µm (h,i).
Figure 4
Figure 4. Resected GBMs show higher growth rates than non-resected GBMs
(a) Summary graph showing the growth rates of primary or recurrent intracranial GBM determined by BLI. Dotted line shows the slope of the GBM growth curves for each group determined by regression analysis. (b-c) Representative images and summary data showing the relative expression levels of the proliferation marker Ki67 (b) and blood vessel marker CD-31 (c) in tissue sections from primary or recurrent GBM. Data are mean±SD, *P<0.05 determined by Students T test (panel b,c). Scale bars, 100 µm.

References

    1. Adamson C, Kanu OO, Mehta AI, Di C, Lin N, Mattox AK, Bigner DD. Glioblastoma multiforme: a review of where we have been and where we are going. Expert Opin Investig Drugs. 2009;18:1061–1083. - PubMed
    1. Asthagiri AR, Pouratian N, Sherman J, Ahmed G, Shaffrey ME. Advances in brain tumor surgery. Neurol Clin. 2007;25:975–1003. viii-ix, - PubMed
    1. Lacroix M, Abi-Said D, Fourney DR, Gokaslan ZL, Shi W, DeMonte F, Lang FF, McCutcheon IE, Hassenbusch SJ, Holland E, Hess K, Michael C, Miller D, Sawaya R. A multivariate analysis of 416 patients with glioblastoma multiforme: prognosis, extent of resection, and survival. Journal of neurosurgery. 2001;95:190–198. - PubMed
    1. Stark AM, Nabavi A, Mehdorn HM, Blomer U. Glioblastoma multiforme-report of 267 cases treated at a single institution. Surg Neurol. 2005;63:162–169. discussion 169. - PubMed
    1. Fomchenko EI, Holland EC. Mouse models of brain tumors and their applications in preclinical trials. Clin Cancer Res. 2006;12:5288–5297. - PubMed

Publication types

Substances